
Maksym Starykov1, Frank Van Hoorn2
1Palfinger Marine, Bergen, Norway
2Argonautics Marine Engineering Inc., Windsor, United States
Submitted 1 May 2016; resubmitted 5 June 2016, 9 October 2016; accepted 13 November 2016;
first published online
ABSTRACT
For the last decades, fully erected container cranes have been delivered to a customer site by ships. On one hand, using this method of transportation is very attractive due to its cost and time savings. However, on the other hand, being exposed to cycling loads from the ship motions during the sea voyage, the crane structure accumulates fatigue damage. Using the accumulated fatigue damage parameter, the crane transportation could be associated with the amount of the working cycles the crane could have worked out during its normal operating at the customer site. In the presenting paper the research for the real case of a new crane voyage from China to Ukraine has been done.
Keywords: crane sea transportation; fatigue damage accumulation; ship motion accelerations; finite element analysis; container crane; ship-to-shore (STS) crane.
INTRODUCTION
In general, practice of lifting cranes they could be delivered from the manufacturer factory to a customer site in two different ways:
– By means of railway. In this case, the crane is erected on the factory, passes all the tests, then is dismantled back into major parts, which are loaded onto platforms and delivered to a customer site (Verschoof 2002). Main disadvantages of this method are the necessity of time and costs for the crane additional erecting, disassembling; the final erecting on the customer site takes time and quite a space, and in the case of a container terminal the terminal owner experiences certain inconvenience.
– By means of sea transportation. In this case the fully erected and temporarily reinforced crane is loaded on a ship of special type, secured by lashings and some additional supports (in some cases it could be partly dismantled) and transported by sea. This method has been being used to deliver the relatively large crane to the customer site for the last 20 years. The main obvious merits are time and cost savings, the possibility to use the machine in short time after its delivery (Pilsch 2004; Van Hoorn 1991; Blackham 1989).
I. Statement of Research Problems and the Technique for their Decision
The main disadvantage of the crane delivery by means of sea transportation could be understood after a closer look at the cyclic loads, which act on the carried crane from the ship motions along the whole voyage. The loads could have quite significant magnitude and amount of cycles, which leads to fatigue damage accumulation (Murakami 2012) in the crane elements and joints. In the other words it means that after a new crane is delivered by sea to the customer site it is not a new anymore, but has a condition, which is equivalent to being in operation for some time.
Of course, each transportation case is individual and the following cases are possible:
– the stress level in the crane structure could be lower than the one that creates fatigue damage; then no fatigue damage accumulates and the crane condition at the customer side after the voyage is the same as it was at delivery from the factory.
– transportation routes could be short enough and the crane would not be undergoing significant amounts of load cycles; in this case, the accumulated fatigue damage during the voyage could be very small and neglected.
The main goal of the current research is in finding out if the delivery of the fully erected Ship-to-Shore (STS) crane by vessel damages the crane by decreasing its service life and in the case of positive answer assess this damage in terms of working cycles. The main parameter that is checked by structural engineers on the project preparation stage is the static strength of the crane structure, lashing elements, deck of the carrying vessel and all the reinforcements. Unfortunately, investigations of the influence of a fully erected crane transportation by sea on its residual life, which involves fatigue analysis of the structure but not only static strength, have not been found. In this paper, the analysis for specific case has been done in order to assess such influence.
Thus, the novelty of the current research is in the investigation of carried crane service life decreasing due to the sea voyage based on fatigue damage accumulation assessment.
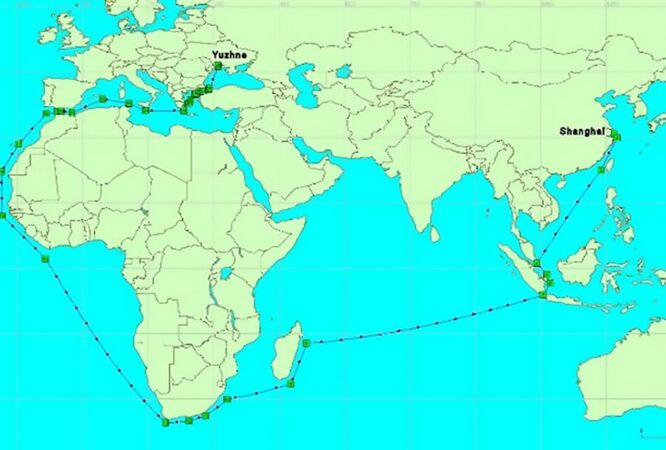
Fig. 1. The ZPMC vessel route, which transports the quay crane from Shanghai (China) to Yuzhne (Ukraine) – the small green squares contain the date when the ship passed the point
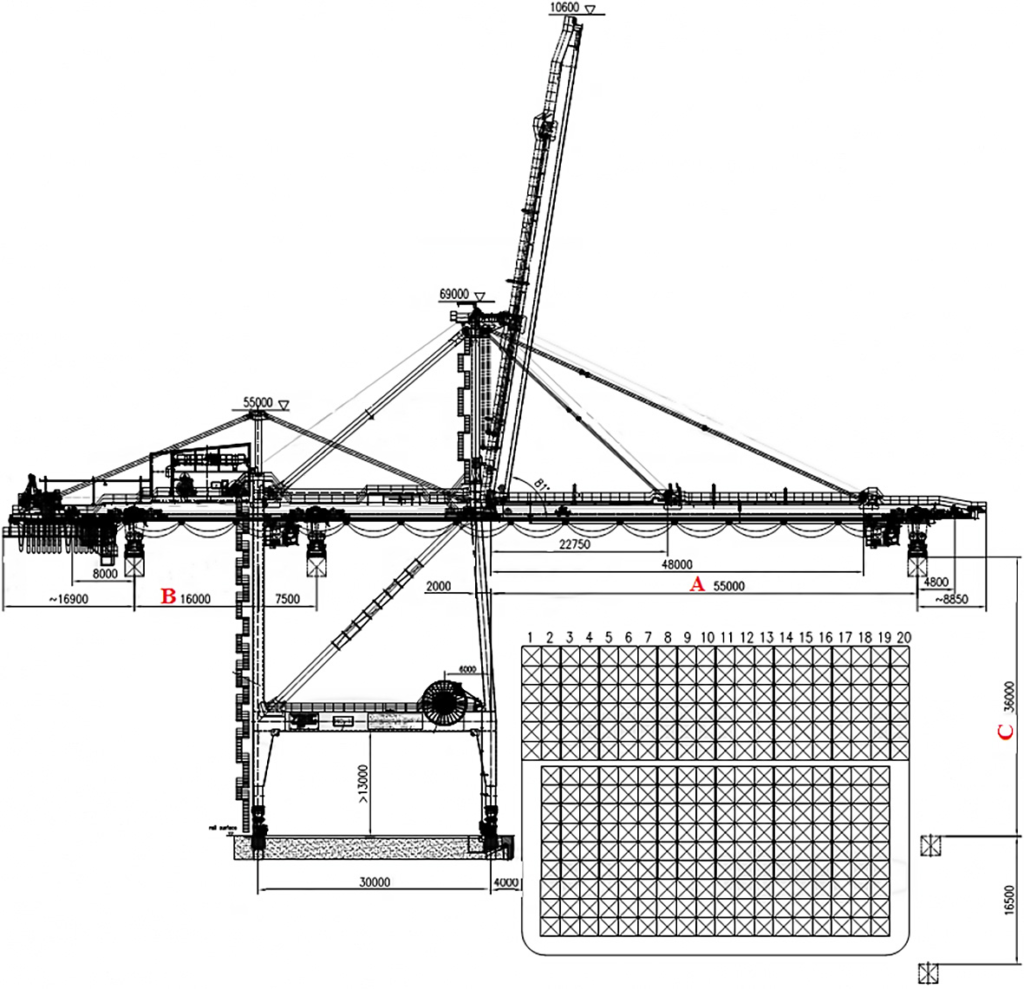
Fig. 2. The quay crane general arrangement, the cross section of the container carrier with the numbers of container rows are shown at the right lower corner (#1 – #20)
A real case of a ZPMC© quay crane (http://www.zpmc.com) delivery from China to Ukraine has been used for this analysis. The route is shown in Fig. 1.
The basic crane (Fig. 2) parameters are as follows:
– lifting load under the spreader – 60 tons;
– outreach A – 55 meters;
– back reach B – 16 meters;
– lifting height (above rail) C – 36 meters;
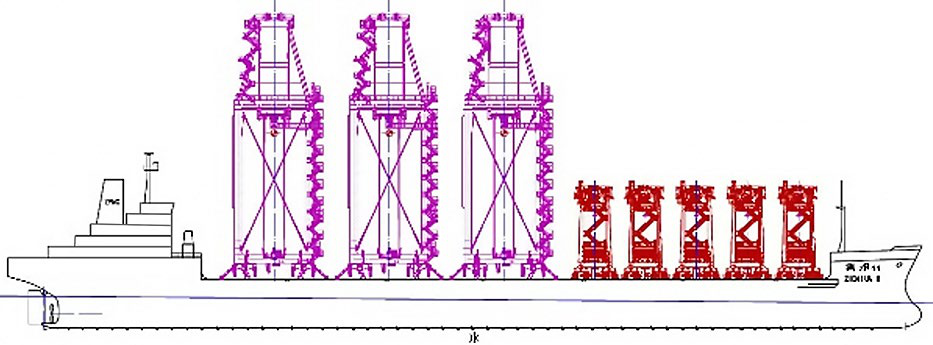
The cranes position on the ship during its transportation is shown in Fig. 3.
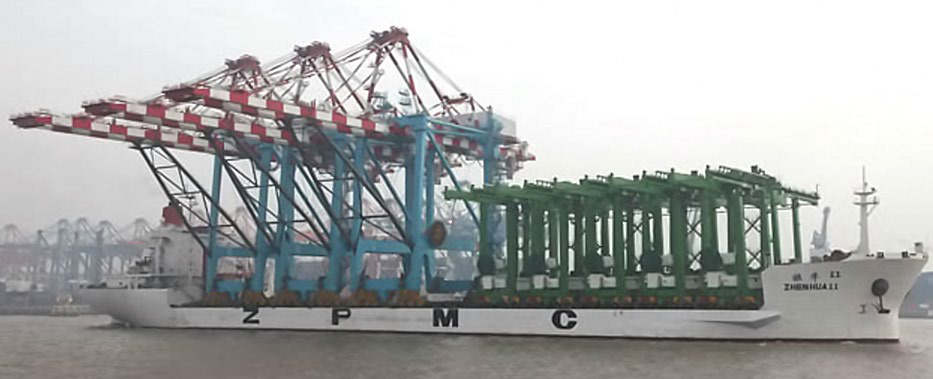
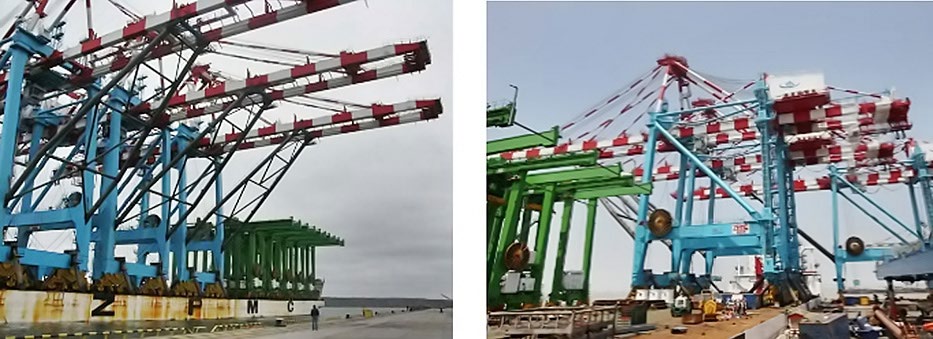
Fig. 3. The crane on the ship’s deck: a – cranes arriving to the port quay; b – ship with the cranes at the port harbour; c – unloading of the cranes to the quay
The analysis of the crane has been split into three major stages. On the first stage, the loads on the crane structure due to the ship motions have been calculated. The second stage involves finite element analysis for crane static strength under the influence of the mentioned above loads. On the last stage, based on the obtained stress data for the crane structure during the voyage and using a specially created program, fatigue damage accumulated in the crane structure has been calculated.
2. Loads from Ship Motion Determination
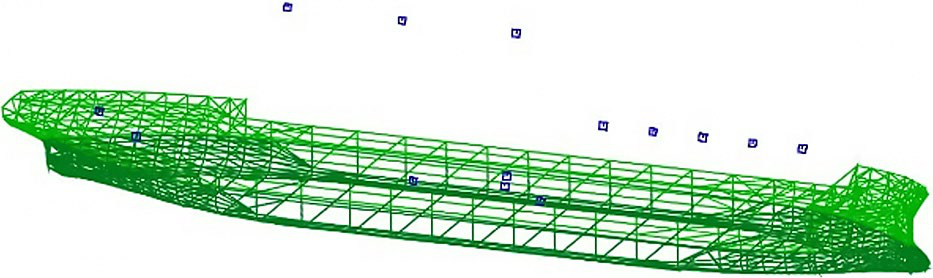
Based on the limited data available, the ZHEN HUA 11 vessel was modelled based on the hull of a standard bulk carrier, converted into the crane carrier, with identical dimensions (similar to the real – full scale – conversion), see Van Hoorn (2005), Van Hoorn and Devoy (1990). For the computer model of the resulting hull (Fig. 4) the loading condition was prepared based on the crane and Rubber Tyred Gantry Crane (RTG) data, estimated lightship of the vessel, and some additional weights for bunkers, ballast, and some miscellaneous. The approximate stowage plan is presented in Fig. 5.
| ZPMC ship parameter | Parameter’s value | Units |
|---|---|---|
| Displacement | 60300 | T |
| Draft bow | 6.9 | M |
| Draft aft | 8.6 | M |
| GM | 8.3 | m |
| Roll gyradius | 13.9 | m |
| Roll period | 12.5 | s |
For the environmental conditions for the voyage from Shanghai (China) to Yuzhne (Ukraine), the Global Wave Statistics were used. A combined voyage scatter diagram was made by adding all scatter diagrams for the areas crossed together, each weighted with a transit time factor. The same wave database also provides wave direction statistics for the individual areas crossed (BMT Ltd. 1986; Van Hoorn 2008). Combining these with the transit times (exposures) resulting in the following probability for each class of wave heading:
– 34% exposure to head and following seas;
– 49% exposure to bow and stern quartering seas;
– 17% exposure to beam seas.
With the combined total voyage scatter diagram and using the MOSES© software, the vessel motions and point accelerations at the crane Center of Gravity (CG) were calculated for each wave height – wave period combination. This resulted in double significant design acceleration scatter diagrams for each of the 3 main directions. For each direction, the linear accelerations were grouped in 0.1·g interval classes and the numbers in each class were totalled, as presented in Table 2. The double or full cycle significant (mean of highest 1/3) values give a good representation of the accelerations acting on the crane CG in each of the three main directions.
The loads are represented by linear accelerations along all three axis that are considered to be applied to the crane CG (Table 2). Total amount of oscillations is 461000, cycle time is 10 seconds.
For the crane structural analysis, its model with lashing elements has been created (Fig. 6).
Table 2. Accelerations applied at the crane CG structure due to the ship motions
| Acceleration range in units of g | Longitudinal acceleration oscillations (total)* | Lateral acceleration oscillations (total)* | Vertical acceleration oscillations (total)** |
|---|---|---|---|
| 0.0–0.1 | 459324 | 345259 | 424125 |
| 0.1–0.2 | 1676 | 77234 | 33430 |
| 0.2–0.3 | – | 26347 | 3292 |
| 0.3–0.4 | – | 7867 | 148 |
| 0.4–0.5 | – | 3443 | 5 |
| 0.5–0.6 | – | 549 | – |
| 0.6–0.7 | – | 209 | – |
| 0.7–0.8 | – | 59 | – |
| 0.8–0.9 | – | 32 | – |
| 0.9–1.0 | – | 1 | – |
Notes: * – includes static part; ** – excludes static part 1·g.
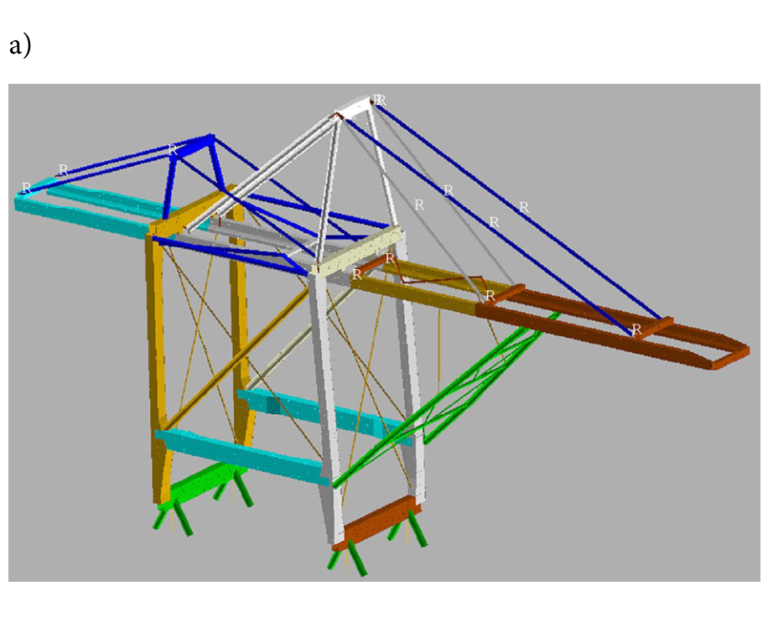
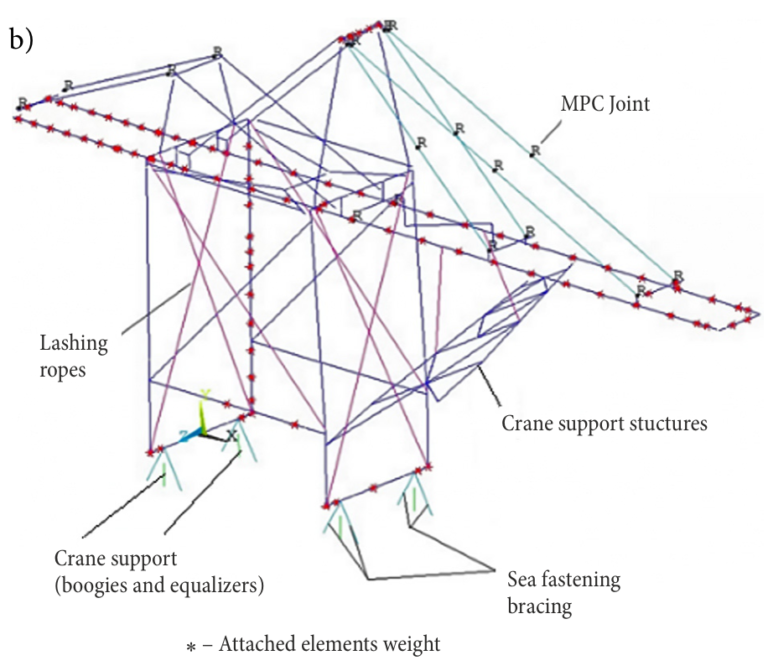
Fig. 6. The crane finite element model: a – the beam model with shown beam element sections; b – crane skeleton model (beam sections are turned off)
3. Model Description
The crane model has been prepared using ANSYS© utilizing finite element approach for stress calculation (Madenci, Guven 2015; Arslan 2015; Stolarski et al. 2006). The following finite elements have been used (Fig. 6):
– BEAM – for modelling of crane main elements (as legs, girder, boom, A-frame, stays etc.) and reinforcement structures (as boom support and crane four corner additional supports);
– LINK – for lashing ropes. Initial pretension (2 tones) in each rope has been modelled;
– MPC – for modelling of joints with only rotational degree of freedom. In order to model the saddle pin behavior the boom-girder joint has been modelled with the rotation restrictions;
– MASS – for modelling attached elements masses, as machinery, trolley rails, ladders and platforms, elevator etc.
The linear model of a material behaviour has been chosen with Young modulus (E = 2·1011 Pa) and Poisson ratio (n = 0.3).
The model loadings have been applied during two phases: preparatory loading steps and main loading steps.
The first preparatory loading step corresponds to the quay crane situated on the ship deck just after its disposal. It means there are neither supporting nor reinforcing structures installed yet (Fig. 7). The crane structure has been loaded by its self-weight and prestressed lashing ropes. Under the applied forces, the structure had the initial deformation. The crane support structures (boom propping frame including two lashing wire rope that connect middle of the frame with the boom; supporting tubes at all 4 corners of the gantry) have also been modelled on the first stage, but turned off using birth/death element technology.
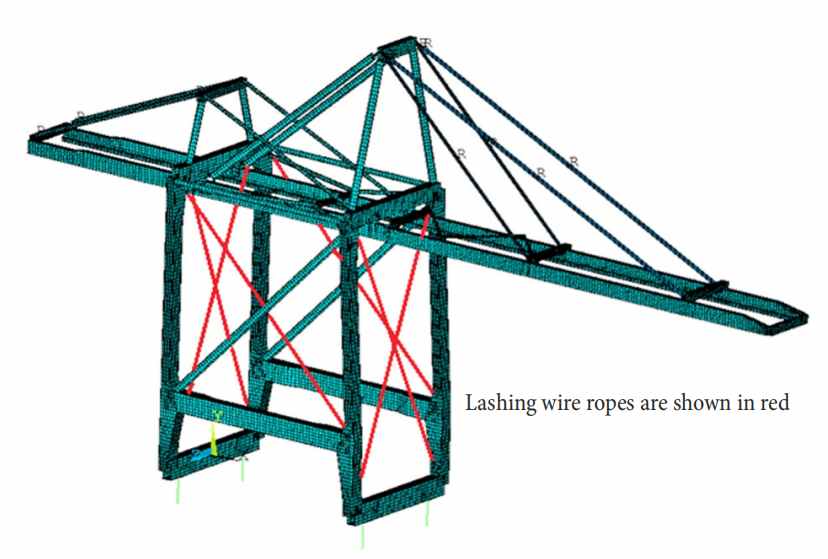
Fig. 7. Crane structure considered on the first preparatory loading step
On the second preparatory loading step, the crane support elements have been turned on (Fig. 8), and started propping the initially deformed crane structure. The main point of the splitting the preparatory loading into two steps is to model real situation, when the support elements have been applied to the deformed crane structure and therefor the only stress that could appear in the reinforcement comes from ship motions and reinforcing elements self-weight.
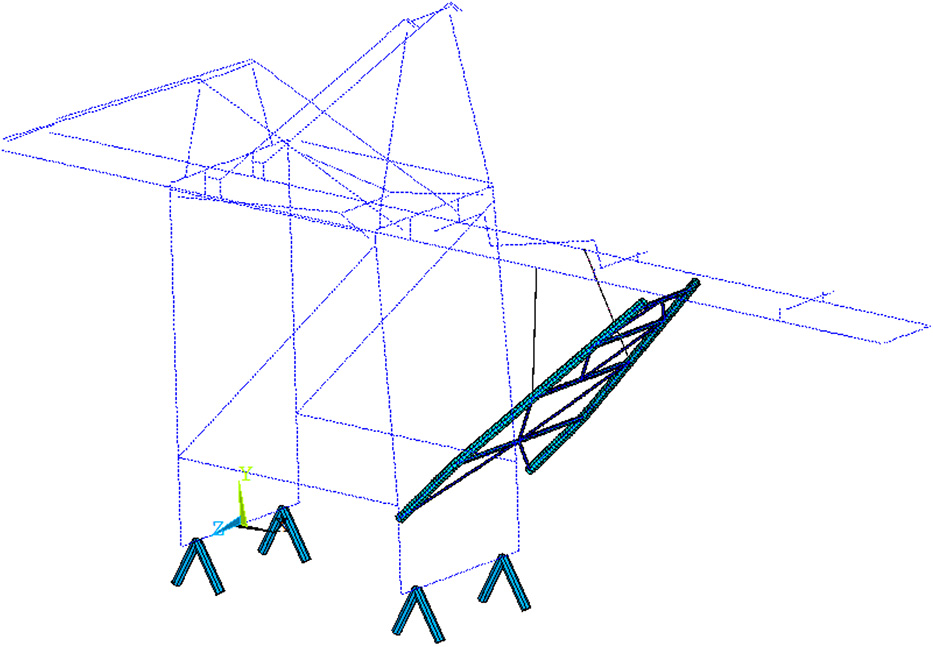
Fig. 8. Crane reinforcement elements, turned on the second preparatory loading step
The boundary conditions for the crane attachment to the ship deck modelling are shown in Fig. 9.
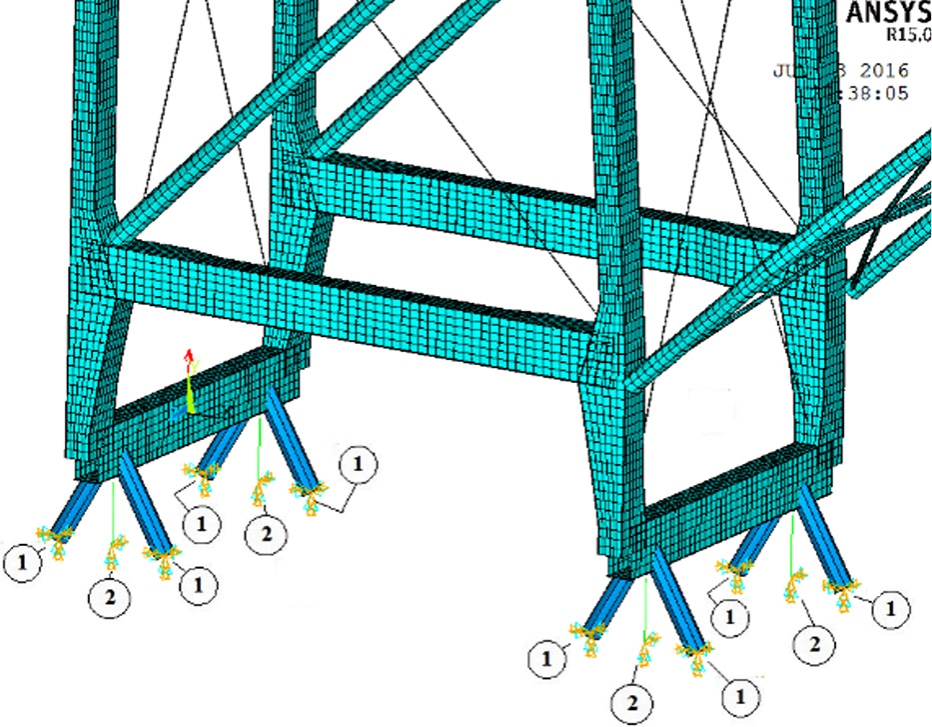
1 – all degrees of freedom are fixed
2 – translation along Y and Z axis and rotations about Y and Z are fixed
Fig. 9. Boundary conditions, applied to the crane structure at first and second phase
During the second phase, the loading cases that represent the structure loading with acceleration (according to the Table 2) due to the ship motions have been created (Strain, Miller 2013). For each acceleration class two loading cases have been created with acceleration acting in two opposite directions. As far as the number of cycles are given for the acceleration range, in calculation the mean value of the acceleration class range has been used.
For instance, for the longitudinal acceleration class (0.2–0.3)·g the mean value range of 0.25·g has been taken and two loading cases have been created, first one with acceleration of +0.125·g and the other with –0.125·g. Subtracting the second loading case from the first one gives the loading case with the stress range in the crane structure.
In addition to the stress information for the further fatigue analysis, the information regarding structure elements FATigue classification (Draper 2008) is needed. For this purpose, the FAT class has been assigned to all elements of the crane main structure (Fig. 10).
For the last phase of the analysis, the special program has been created (Stroustrup 2014) that uses the external information about structure elements FAT classification and the stress for loading cases for input data. The algorithm of the program is shown in Fig. 11.
The program utilizes the nominal stress approach acc. (BS EN 13001-2:2014; Hobbacher 1996) and Palmgren–Miner cumulative damage rule (Lemaitre, Desmorat 2005; Chaminda 2015).
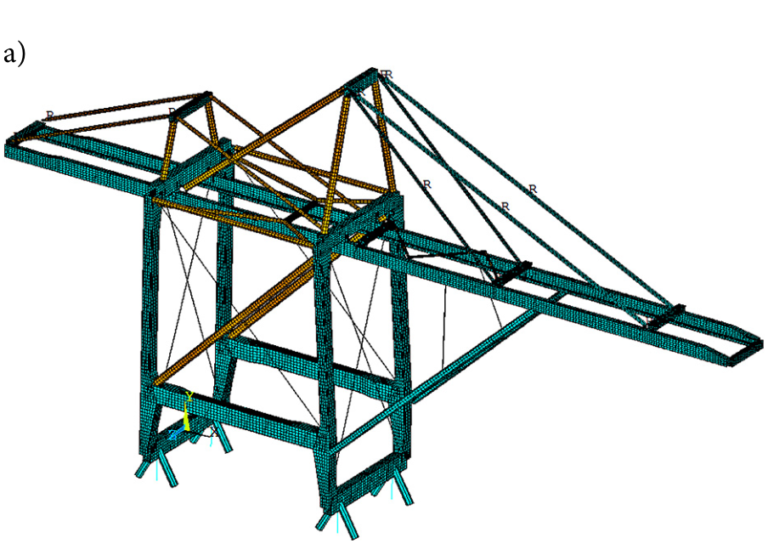
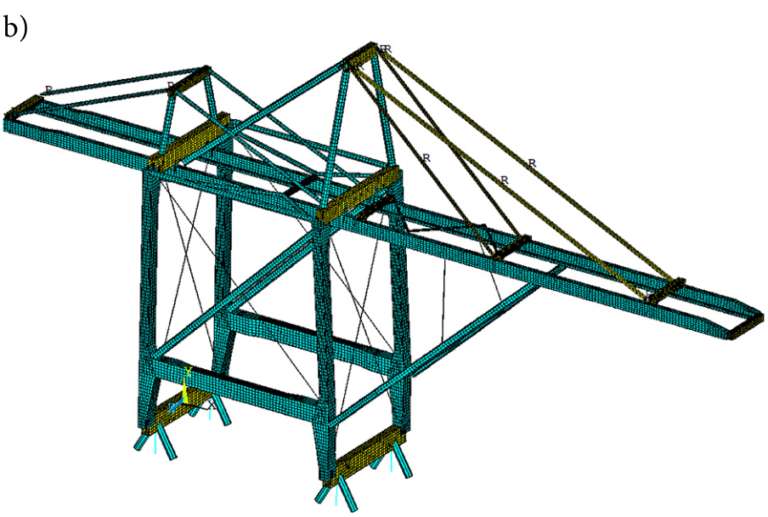
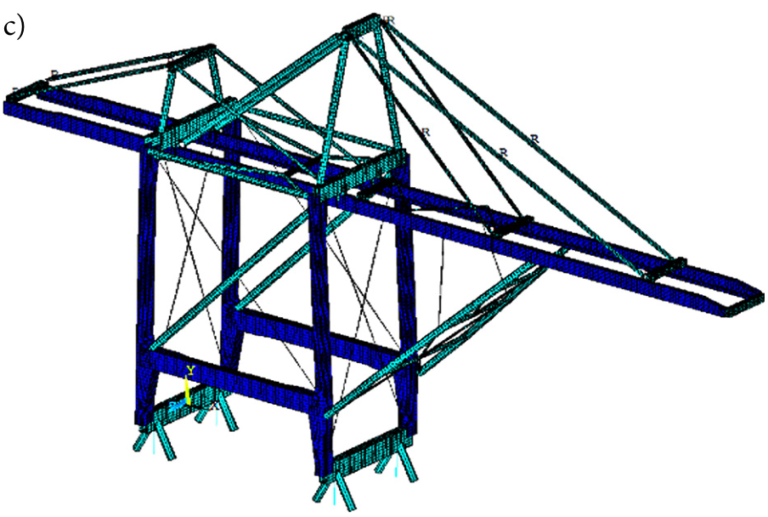
Fig. 10. Elements with assigned FAT classes: a – elements with the fatigue class FAT 63 (light brown colour); b – elements with the fatigue class FAT 71 (yellow colour); c – elements with the fatigue class FAT 80 (blue colour)
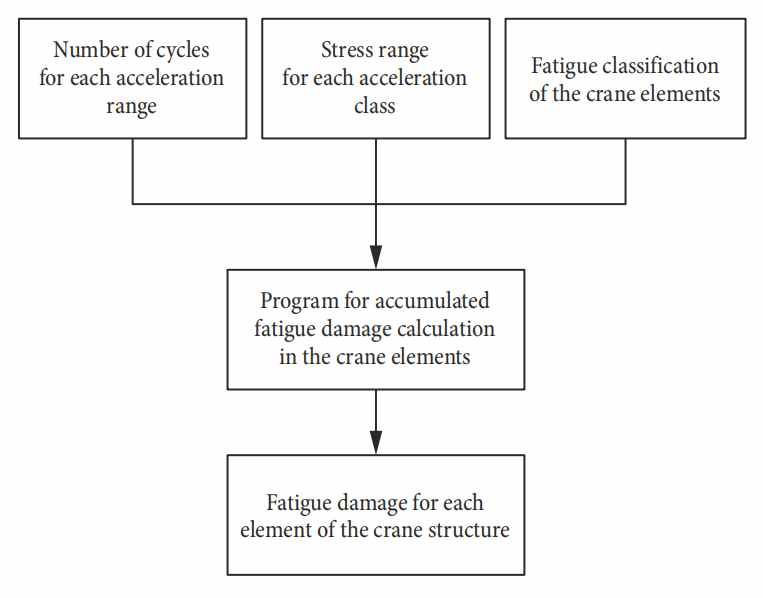
Fig. 11. Customer fatigue analysis program algorithm
The result of the program operation is the information about accumulated fatigue damage in each element.
Basic assumptions, used in the program algorithm, are as follow:
– FAT class is the same for all areas of the element section; the lowest FAT for the section has been used for calculation;
– tensile and compressive stresses are considered as equally dangerous ones;
– the element fatigue life correction due to the element thickness has not been taken into account (for elements with thickness more than 25 mm); however, for the crane structure almost all elements have plate thickness up to 25 mm; the only exception is the Trolley Girder Support seaside Beam (TGSB) with the biggest thickness of 30 mm and the fact that it is not a fatigue critical element justifies avoiding using plate thickness correction in program;
– all the accelerations due to the ship motions have been considered acting separately rather than in combination.
According to the recommendations for the fatigue analysis (Hobbacher 1996) the critical accumulated fatigue damage value is 0.5 and according to FEM European Materials Handling Federation (1998) it is 1.0.
The results of the fatigue damage accumulation (Lee et al. 2005) for the crane exposed to longitudinal, vertical and transversal accelerations are shown in Figs 12 and 13. The maximal accumulated fatigue damage D of the range from 0.1 to 0.05 has been found in the boom diagonal beam (Fig. 12). The Fig. 13 shows the elements with the maximal accumulated fatigue damage from 0.05 to 0.025.
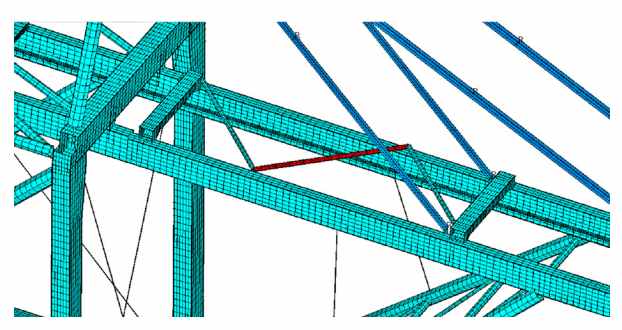
Fig. 12. Elements with the maximal accumulated fatigue damage from 0.1 to 0.05 (boom diagonal, red colour)
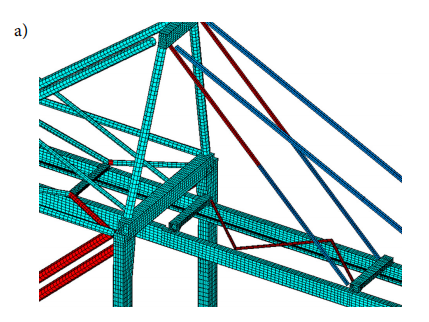
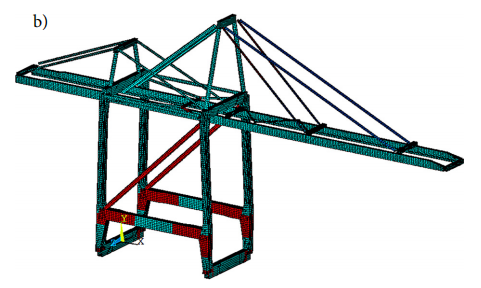
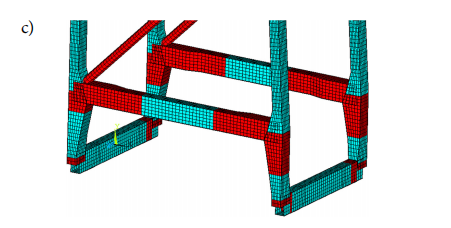
Fig. 13. Elements with the accumulated fatigue damage from 0.05 to 0.025 (red colour): a – zoomed upper part of the crane structure near A-frame; b – general arrangement of the structure; c – zoomed lower part of the gantry structure
The fatigue analysis shows that during the crane transportation on the deck of the ship the crane structure has been damaged by the loading cycles, initiated by the ship’s motions. Using the accumulated damage values the crane transportation could be associated with the amount of the working cycles the crane could have worked out during its normal operating at the customer site (Table 3).
Table 3. Crane transportation association with its normal operation
| Critical elements with accumulated fatigue damage and as the result decreased service life due to the transportation | Calculated damage, accumulated during the sea transportation Di | D1 – crane element’s life (maximal) lost during the crane transportation, based on critical value of fatigue damage D = 1* | Crane element’s life lost (maximal) during the crane transportation, based on critical value of fatigue damage D = 1, working cycles** | Crane element’s life (maximal) lost during the crane transportation, based on critical value of fatigue damage D = 0.5* | D0.5 – crane element’s life (maximal) lost during the crane transportation, based on critical value of fatigue damage D = 0.5, cycles*** |
|---|---|---|---|---|---|
| Boom diagonal beam (Fig. 9) | 0.1–0.05 | 10% | 200000 | 20% | 400000 |
| Leg parts, portal diagonals, lower TGS beam, sill beam | 0.05–0.025 | 5% | 100000 | 10% | 200000 |
Notes:
* – the calculation is done D – Di D ·100%;
** – assuming crane life of 2 million cycles, crane element lost life is D1 100% ·2·106;
*** – assuming crane life of 2 million cycles, crane element lost life is D0.5 100% ·2·106.
Of course, not all elements that have accumulated fatigue damage are critical from the fatigue point of view for normal operation. The good example is the boom diagonal, which is almost not loaded during the crane normal exploitation.
4. Discussion of the Obtained Results
According to the obtained results of the fatigue damage calculation, accumulated during the crane transportation by sea, it appears that up to 20% of the crane life has been used during its transportation. The crane that came down to the customer’s port was not the new crane, but already ‘used’. The fact the crane had lost such significant part of its structure life could give the customer some negotiation freedom in terms of either price reduction, increasing the warranty period or the other options.
For different cases of sea transportation, such discussions between the manufacturer and customer should be based on the analysis, which could be similar to the one, shown here.
The performed analysis has been done based on accelerations of the ship, obtained from the computer modelling based on Global Wave Statistics (BMT Ltd. 1986). The computer analysis very often gives overestimated results (Van Hoorn 2005) and for more precise fatigue damage accumulation in the crane structure the strain measurement technic during the whole voyage could be used.
For this case before the voyage, the fatigue analysis should have been done in order to find the possibilities to minimize the accumulated fatigue damage by proper transportation plan (lowering down the CG of the whole crane by partly dismantling boom, girder and/or A-frame). The best transportation scheme is the one, for which the ship accelerations induces in the crane structure stresses with amplitude less than the endurance limit and the fatigue damage does not accumulates. Instead of this the manufacturer of the crane applied to the structure some reinforcements, but their positions and amount were decided from static strength point of view and that have not prevent fatigue damage accumulation.
Conclusions
1. The main merits of a crane transportation by sea, as time and cost savings, are well known and it is the main reason why this type of delivery is widely used nowadays. However, at the same time, nobody pays attention what happens with the crane during its sea voyage from the fatigue point of view, when it could be exposed to forces from the ship motions, and those forces, having both big magnitude and significant amount of cycles, could cause the crane structure fatigue damage accumulation.
2. In order to assess the significance of the fatigue damage for such crane delivery the analysis of the real case of a quay crane transportation from China to Ukraine has been carried out. It shows that during the transportation basic crane elements, as legs, portal pipe strut frame, sill beams, lower TGS beams, boom forestays of the crane structure accumulate up to 5 or 10% of the critical fatigue damage value (depends on the using critical value).
3. Using the parameter of the fatigue damage, the loading cycles, which acted on the crane during its sea voyage from the ship motions, could be associated with the crane working cycles that it could have worked off in normal operation. For this particular case the sea transportation is equivalent to wasting maximum 100000 or 200000 (depends on the using critical vale) crane operational cycles for such crane element, as legs, portal pipe strut frame, sill beams, lower TGSB, boom forestays.
4. Using either proper designed crane structure support or partial dismantling of the crane elements could decrease significantly or in some cases even totally eliminate the fatigue damage accumulation during the crane transportation. For this, the additional fatigue crane structure analysis is needed, but the expenses for it will be fully covered by decreased costs for the further crane structural repair and downtime costs.
References
Arslan, M. A. 2015. Hands on Applied Finite Element Analysis Application with ANSYS. Self Publishing. 553 p.
Blackham, A. 1989. Use of Meteorological Information for Warranty Surveying Purposes. The Nautical Institute, London.
BMT Ltd. 1986. Global Wave Statistics. British Maritime Technology Ltd., London.
BS EN 13001-2:2014. Crane Safety. General Design. Load Actions.
Chaminda, B. 2015. Fatigue Damage Assessment of Steel Structures and Components. Lambert Academic Publishing. 200 p.
Draper, J. 2008. Modern Metal Fatigue Analysis. EMAS Publications. 291 p.
FEM European Materials Handling Federation. 1998. FEM 1.001: Rules for the Design of Hoisting Appliances. 3rd edition. 305 p.
Hobbacher, A. 1996. Fatigue Design of Welded Joints and Components XIII-1539-96/XV-845-96. Abington Publishing. 127 p.
Lee, Y.-L.; Pan, J.; Hathaway, R. B.; Barkey, M. E. 2005. Fatigue Testing and Analysis: Theory and Practice. Elsevier. 402 p.
Lemaitre, J.; Desmorat, R. 2005. Engineering Damage Mechanics: Ductile, Creep, Fatigue and Brittle Failures. Springer. 380 p.
https://doi.org/10.1007/b138882
Madenci, E.; Guven, I. 2015. The Finite Element Method and Applications in Engineering Using ANSYS®. Springer. 656 p.
https://doi.org/10.1007/978-1-4899-7550-8
Murakami, S. 2012. Continuum Damage Mechanics: a Continuum Mechanics Approach to the Analysis of Damage and Fracture. Springer. 402 p.
https://doi.org/10.1007/978-94-007-2666-6
Pilsch, M. C. 2004. West coast container gantry cranes: the paths of Paceco and ZPMC, Pacific Maritime Magazine 7. Available from Internet: http://www.pacmar.com
Strain, J.; Miller, E. 2013. Introduction to the ANSYS Parametric Design Language (APDL): a Guide to the ANSYS Parametric Design Language. CreateSpace Independent Publishing Platform. 210 p.
Stolarski, T.; Nakasone, Y.; Yoshimoto, S. 2006. Engineering Analysis with ANSYS software. Elsevier. 456 p.
Stroustrup, B. 2014. Programming: Principles and Practice Using C++. 2nd edition. Addison-Wesley Professional. 1312 p.
Van Hoorn, F. 2008. Heavy-lift transport ships: overview of existing fleet and future developments, in Marine Operations Specialty Symposium (MOSS 2008), 5–7 March 2008, Singapore, 1–9.
Van Hoorn, F. 2005. Container crane transport options: self-propelled ship versus towed barge, in Marine Heavy Transport & Lift 2005, 20–21 September 2005, London, UK, 1–10.
Van Hoorn, F. 1991. Design criteria for self-propelled heavy-lift transports and how theory correlates with reality, in 2nd Offshore Symposium ‘Design Criteria and Codes’, 4–5 April 1991, Huston, TX, US, XV 1 – XV 13.
Van Hoorn, F.; Devoy, S. D. 1990. The dry transport of the green canyon tension leg wellhead platform by a semisubmersible heavy-lift ship, in Offshore Technology Conference, 7–10 May 1990, Houston, Texas, US, 1–18.
https://doi.org/10.4043/6471-MS
Verschoof, J. 2002. Cranes: Design, Practice, and Maintenance. Wiley. 328 p.