
Maksym Starykov1, Evgenii Kokoshko2
1Liebherr Container Cranes Ltd, Ireland
2Odessa National Maritime University, Ukraine
1m.starykov@gmail.com, 2kokoshko1etc@gmail.com
ABSTRACT
Typical approach to a complex object structural analysis (i.e. building, bridge or crane structure) normally consists of two levels — global analysis of the whole structure and local, more detailed, analysis of the particular elements that are found to be critical. For the second level analysis either force or translation distribution along the sections, the submodel is isolated from the global model by, is used as a boundary conditions. And these boundary conditions are normally taken from the global model analysis.
In the presented work it is proposed an approach that allows performing second level analysis for the structure critical elements without using any data for a boundary conditions from the global model analysis, but using measured strain signal instead. It makes it possible to analyze objects, for which structural drawings are not available.
For sake of illustration it is shown how this approach is utilized in a crane structure residual life assessment project.
Index Terms- Finite element analysis, grab unloader, residual life, crack propagation, strain gauges.
INTRODUCTION
In the engineering practice the most common approach for stress analysis is Finite Element Analysis (FEA). In order to perform the FEA for the crane structure the following information about the crane must be presented:
1. Crane’s line diagram, where all structure elements are represented with their center lines or point masses; in addition, the elements’ sections geometrical parameters are also given (width, height, web/flange thickness etc.).
2. Crane elements’ weight and the Centers of Gravities coordinates.
3. Material properties of the crane elements’ grades.
This information could be taken from the structural drawings of the crane. Normally the crane owner may have the drawings, but in reality, it is quite hard to find the drawings especially for the machine that has been in operation for more than 20 years. Of course, one more way to find this information is to contact the crane manufacturer. However, there may be a fee in receiving these drawings. And also a possibility that the manufacturer no longer exist rendering it impossible to obtain these documents.
In this paper the approach that allows to overcome the structural drawing absence problem is proposed. As an example, the approach is used for 38-year-old Quay Grab Unloader [1] residual life estimation as the FEA is a basic part of such type of project [2].
The idea of the approach is to find several critical elements of the crane, create the FE submodels for each of them based on geometrical measurements, performed on site. And instead of taking the boundary conditions (the forces that represent the action of the rest of the crane on the submodel) for these submodels from the whole crane Finite Element Analysis, get them from the processing of strain gauge signal measured during crane operation.
The residual life assessment approach for the considered Grab Unloader consists of the following steps1:
- Find out the crane critical elements by combining the results from the crane structural survey and the fatigue damage check method based on coercive force measurements.
- Creating FEM models of the structure critical elements using geometrical measurements.
- Measure the stress fluctuation during crane operation using strain gauges.
- Process the measured signal and convert it to the FE model nodal forces.
- Cut the material from the most critical element and test it to find the current, degraded properties of the grade.
- Calculate the residual life of the critical elements based on crack growth modelling, using the material parameters obtained from the test and the “measured” boundary conditions.
1Only the steps of the project that are relative to the residual life assessment are mentioned. The other steps such as motor survey, bearings vibration measurements, forestay force distribution measurements that are not related to the topic of the article have been omitted.
More detailed description of each step is given in coming chapters.
II. RESIDUAL LIFE ASSESSMENT
A. Finding crane structure critical elements
The crane critical elements have been found using the following two methods separately: structural survey; crane structure accumulated fatigue damage measurement. The obtained results have been analyzed and combined.
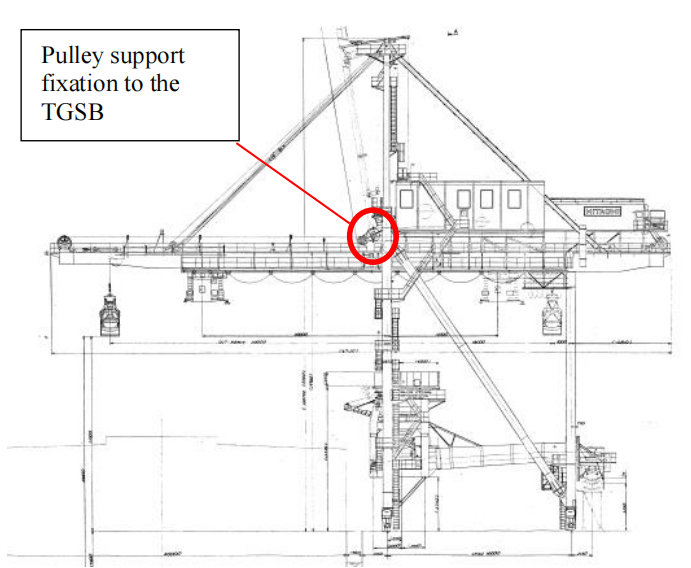
Structural survey. During the structural surveying the fatigue cracks of significant length have been found in the sea side Trolley Girder Support Beam (TGSB), near its center, where pulleys are attached Fig. 1. Thus, the critical element based on structural survey is TGSB central part.
Crane structure accumulated fatigue damage measurement. The approach is based on measured coercive force parameter. The measured coercive force is in proportion with the fatigue damage accumulated in the element. For each grade exists the coercive force critical magnitude that shows that further operation is dangerous and could lead to structural failure. For simplicity the whole range of the coercive force is split into several intervals: Reliable operation, Controllable operation, Critical Operation [3,4,5,6]
The method could be used for the residual life estimation for the tested grades only, where the critical value of the coercive force is found. For the Grab Unloader grade the study of changing coercive force vs number of stress cycles does not exist. That is why only comparison analysis that shows the critical elements could be done instead of finding the residual life directly for each element. The critical elements are the ones with the biggest coercive force magnitude.
Based on the measured coercive force parameter it appears that the critical elements are Boom and Girder.
Combining the surveying results the following critical elements have been taken for the further residual life assessment (see Fig. 2):
- Boom, the section between Boom/Girder hinge and Boom/forestay hinge.
- Girder, between Land side and Sea side legs, just above the hopper where the crane unloads its grab.
- Sea side TGSB middle part, where the pulley support is fixed to it.
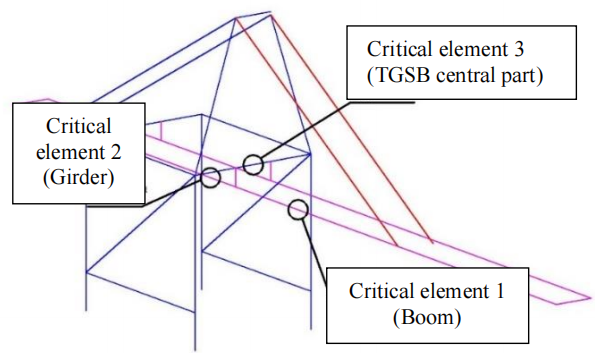
FIG. 2. CRANE STRUCTURE CRITICAL ELEMENTS
B. Creating FEM models of the structure critical elements.
Based on the geometrical measurements performed on site (i.e. member cross section height, width, flange and web thicknesses, bulkheads’ and stiffeners’ geometry etc.) the FE models of the critical elements have been created using ANSYS Mechanical APDL software. As further analysis is planned to utilize the Linear Fracture Mechanics approach one or two cracks have been introduced acc. [7] to each submodel (there are several models for each critical element where the only difference is the crack length). The cracks’ positions are based on preliminary analysis of the element without crack and the cracks were introduced in the areas with the biggest stress range. Each crack is oriented to be normal to the first principal strain. The linear material behavior model is used.
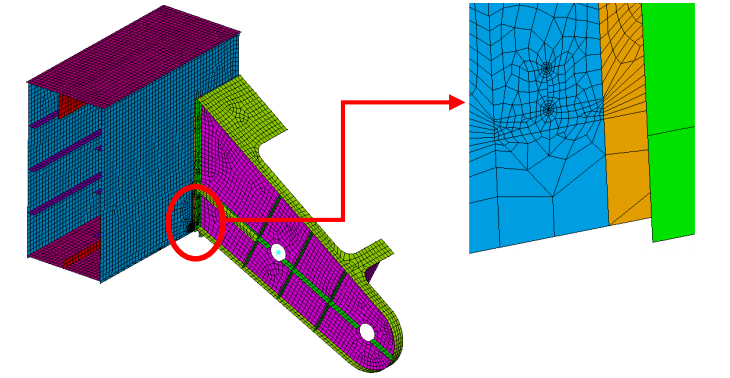
FIG. 3. TGSB SUBMODEL WITH CRACK
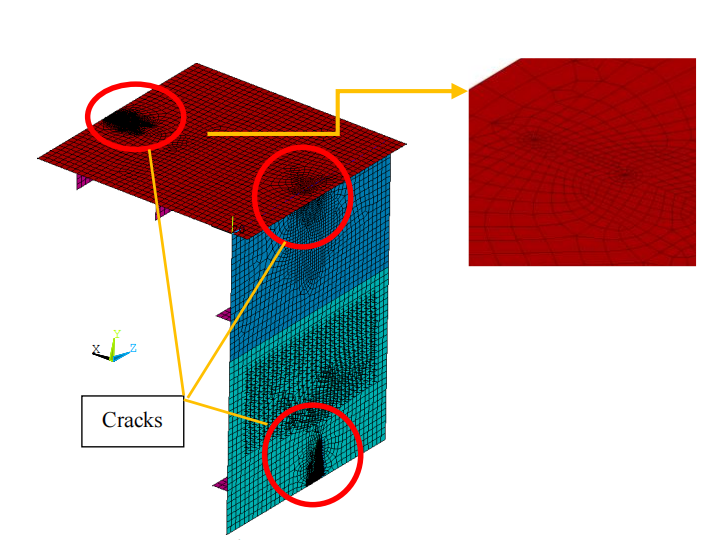
FIG. 4. BOOM SUBMODEL WITH CRACKS
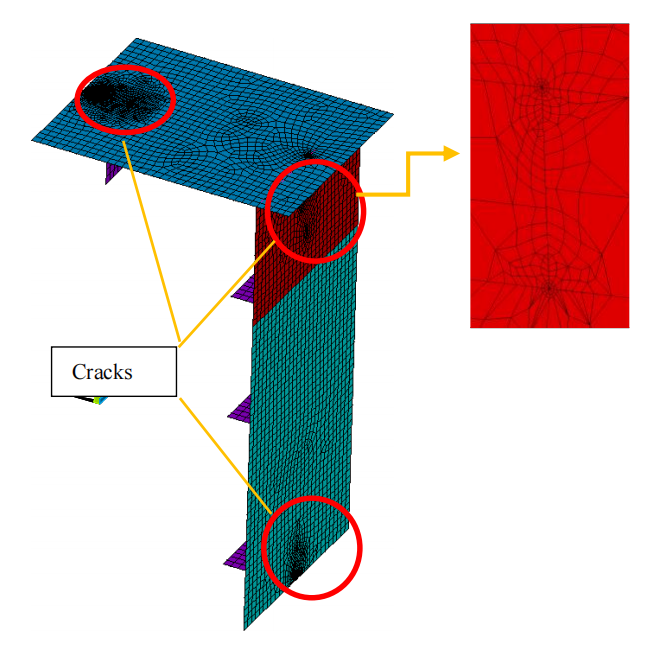
FIG. 5. GIRDER SUBMODEL WITH CRACKS
C. Application of the measured stress for FEM submodels’ Boundary Conditions
Concept: Firstly, the normal and shear stress distribution in a cross section must be found, which shall be used in further boundary condition application. It must then be decided what the minimum amount of the strain gauges, their axis directions and positions along the section would be.
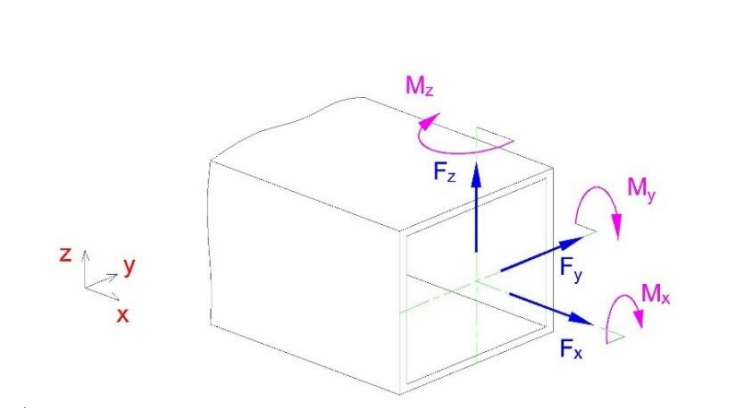
Stress distribution in cross section. For the normal and shear stress distribution the thin wall section beam theory is used. In crane structures the most frequently used types of cross sections are box and I beam types. As soon as all three critical elements of the Grab Unloader have box cross section type, all further analysis is done for this particular cross section type. This approach could be easily used for another cross section type (i.e. I beam). The typical box cross section with internal forces and moments is shown in Fig. 6.
The appropriate stress type (normal and/or shear) is calculated for each load component and the resultant stress distribution is found as a stress superposition. The following rules for the stress signs are used acc. [8]:
For normal stress: tension stress is assumed to be positive; compression stress is assumed to be negative.
For shear stress: positive shear stress acts on positive faces of the material element in the positive direction of an axis. Also, positive shear stress acts on negative faces of the material element in the negative direction of an axis. A positive face has its normal vector in the positive direction of an axis, and a negative face has its normal vector in the negative direction of an axis.
Normal stress from normal to the cross section force Fx:
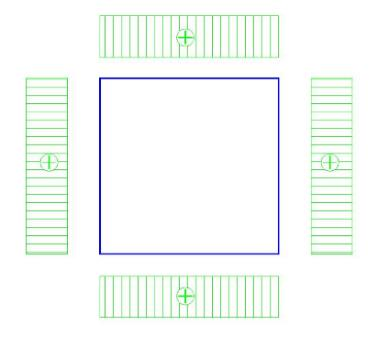
σFx = Fx A (1)
where A – cross section area, m2.
Shear stress distribution from Mx torque:
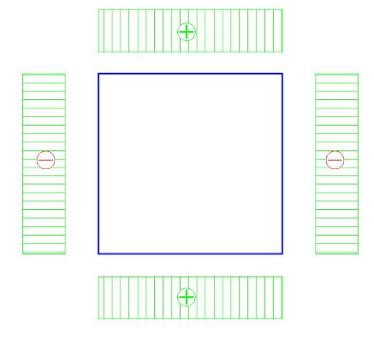
τMx = Mx 2∙Asect∙tf (2)
Shear stress in the webτMx = Mx 2∙Asect∙tf (3)
where Asect – sectoral area for torsion of the cross section, m2; tf – flange thickness, m; tw – web thickness, m.Normal stress distribution from My bending moment:
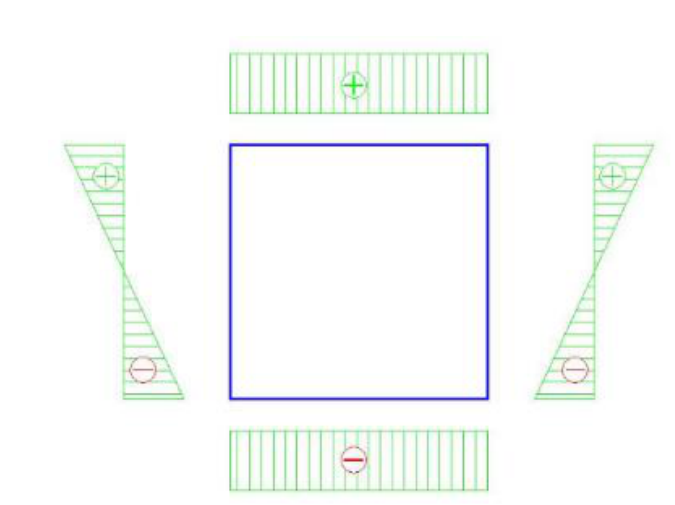
σMy = My Wyy (4)
where Wyy — section modulus for Y axis, m3.
FIG. 9. NORMAL STRESS PLOT FOR MY
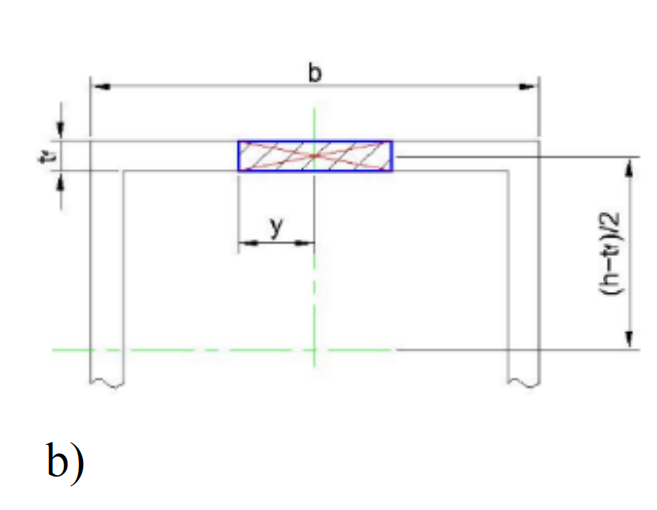
Shear stress distribution from Fz shear force:
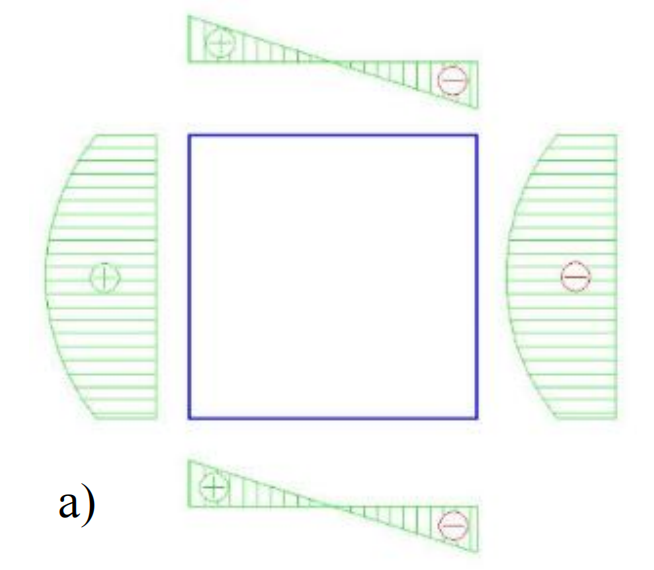
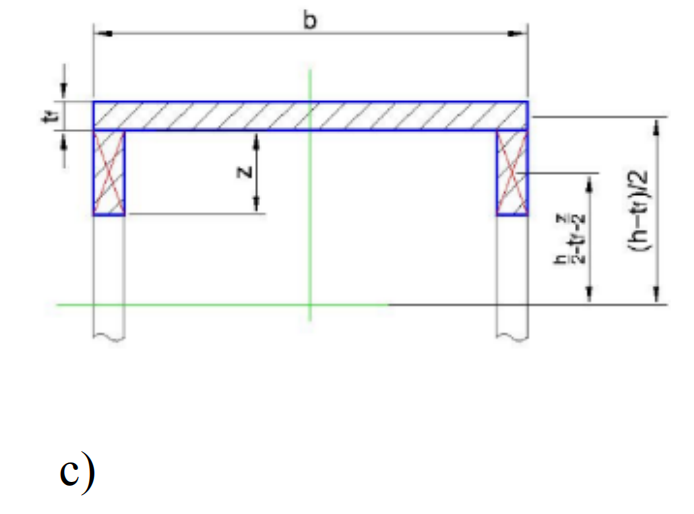
Shear stress in the flange
Shear stress in the web
Where
Sup_fl – first moment of upper flange area (variable);
where y – is a current coordinate, m;
b – cross section width, m.
Sf+w — first moment of upper flange and web area (variable).
where z – is a current coordinate, m.
FIG. 10. SHEAR STRESS PLOT FOR FZ
Normal stress distribution from Mz bending moment:
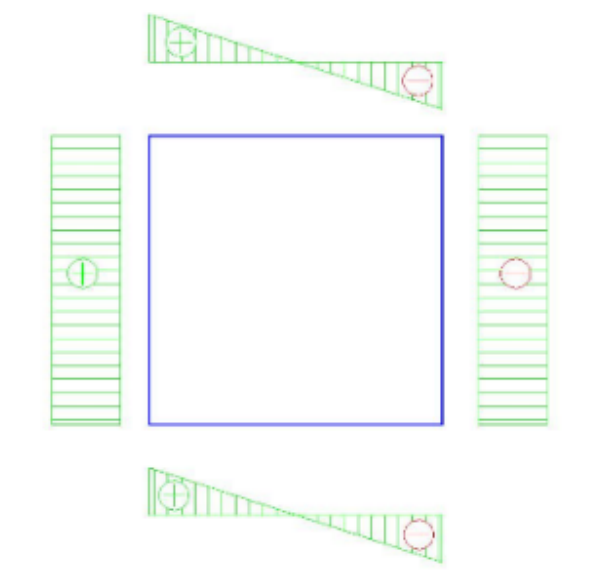
σMz = Mz Wzz (9)
where Wzz — section modulus for z axis, m3.
FIG. 11. NORMAL STRESS PLOT FOR MZ
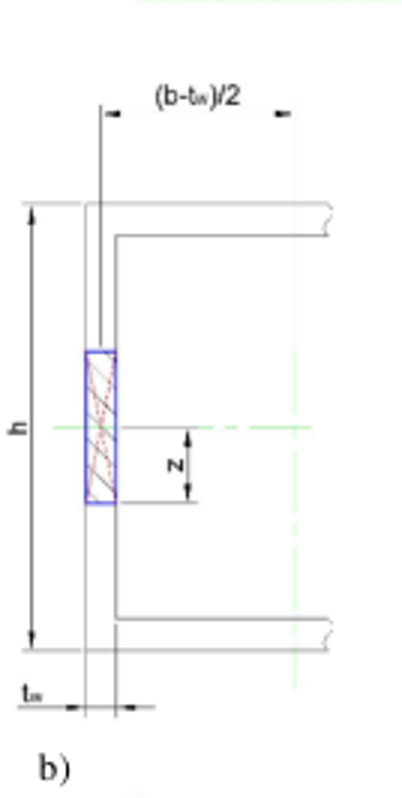
Shear stress distribution from Fy shear force:
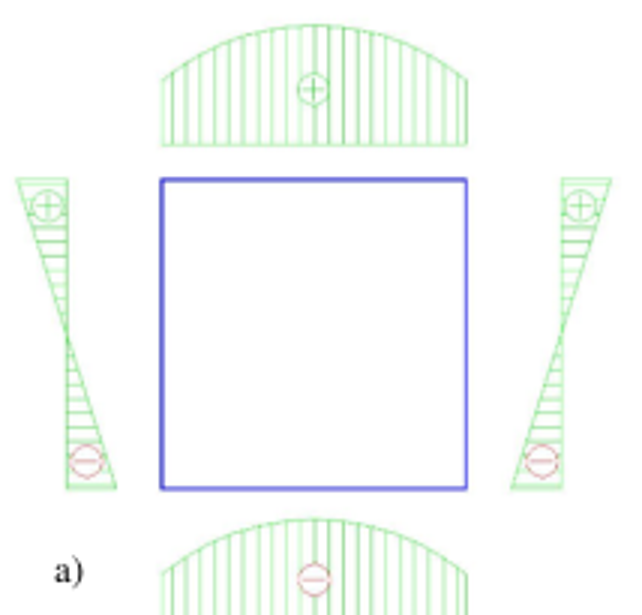
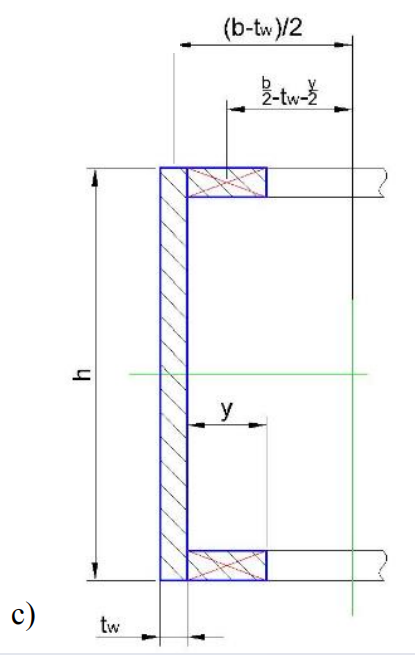
Shear stress in the flange
Shear stress in the web
Where
where z – is a current coordinate, m;
b – cross section width, m.
where y – is a current coordinate, m;
FIG. 12. SHEAR STRESS PLOT FOR FY
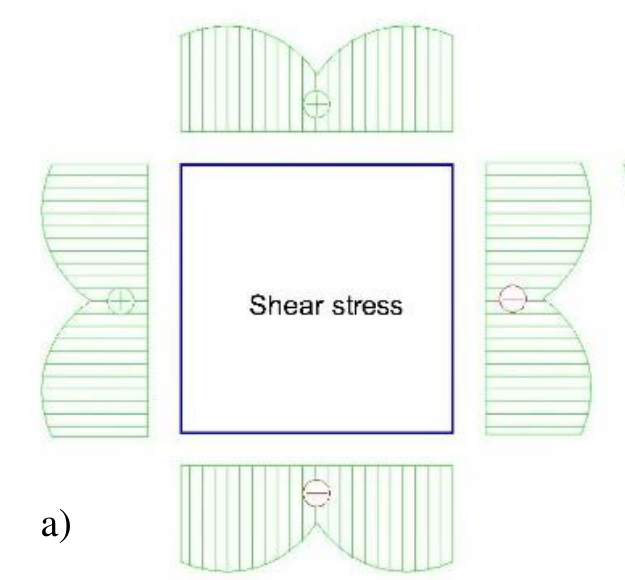
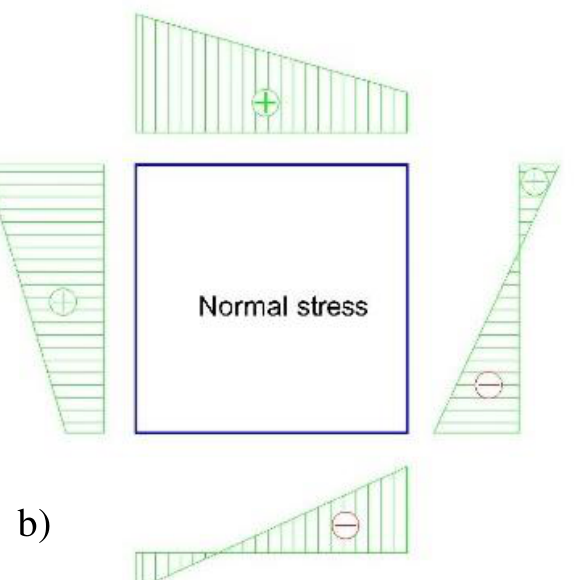
FIG. 13. STRESS DISTRIBUTION OVER THE CROSS SECTION
Stress superposition for all forces and moments is shown on Fig. 132.
D. Strain gauge minimum amount and positions.
2 shear stress along each edge is symmetrical with regard to the face normal the edge belongs to
At this stage the minimum amount of strain gauges required to reconstruct the stress distribution, based on measurements, must be determined. Having analyzed the stress distribution it could be concluded that:
- the normal stress is represented by polynomial with the maximum order of 1;
- the shear stress is represented by polynomial with the maximum order of 2.
In other words, it is required to have measurements from at least two point along each edge to reconstruct the normal stress distribution and at least three points to reconstruct shear stress distribution.
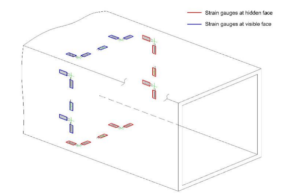
FIG. 14. MINIMUM AMOUNT OF THE STRAIN GAUGES FOR BOX SECTION TYPE BEAM
Application. The strain has been measured during 26 crane operational cycles using the modern 64-channel data acquisition device, Fig. 15, [9]. The device has several position sensors that were located along the Boom and Girder to show the trolley position during the measurements.
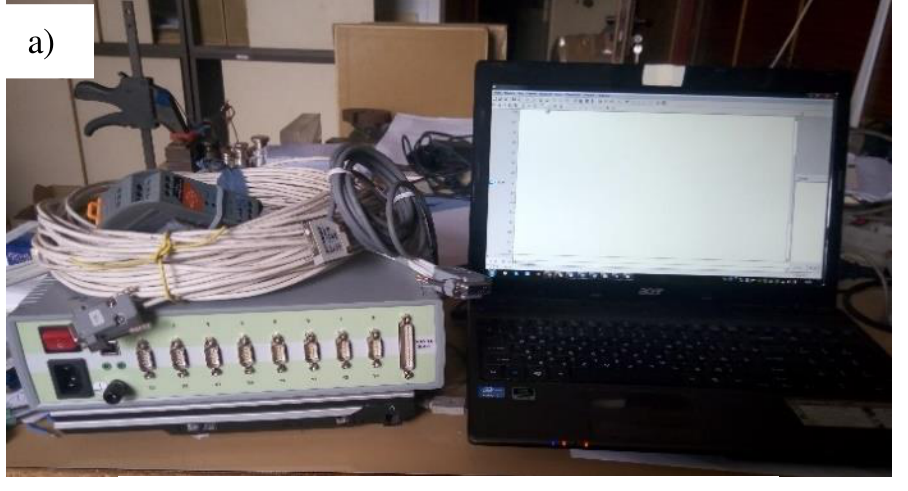
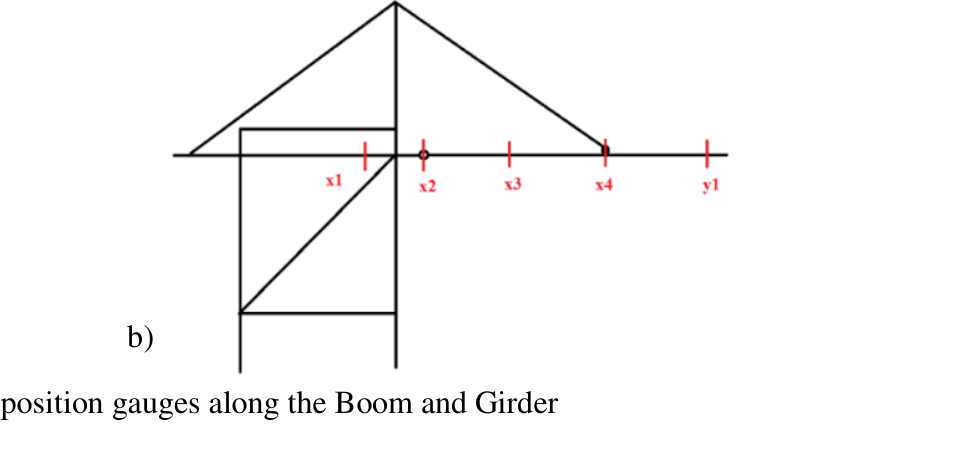
FIG. 15. STRAIN GAUGE SIGNAL MEASUREMENT DEVICE
The strain gauges have been attached from the inner side of the structure. The gauges, positioned along and transversely to the critical element axis, were used; the positions are shown in Fig. 16 by arrows that are the gauge center lines.
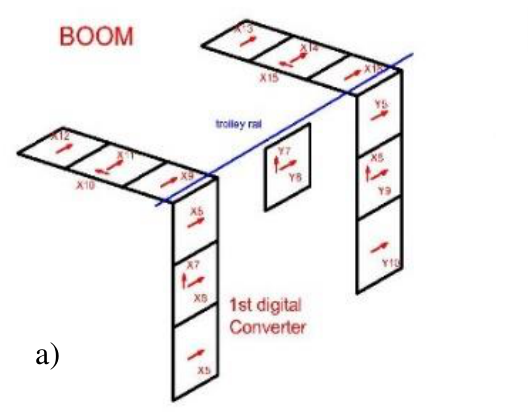
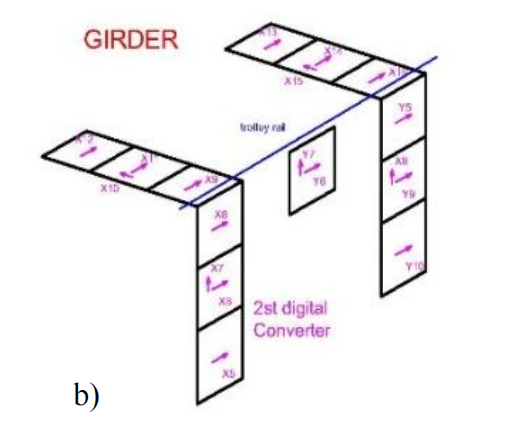
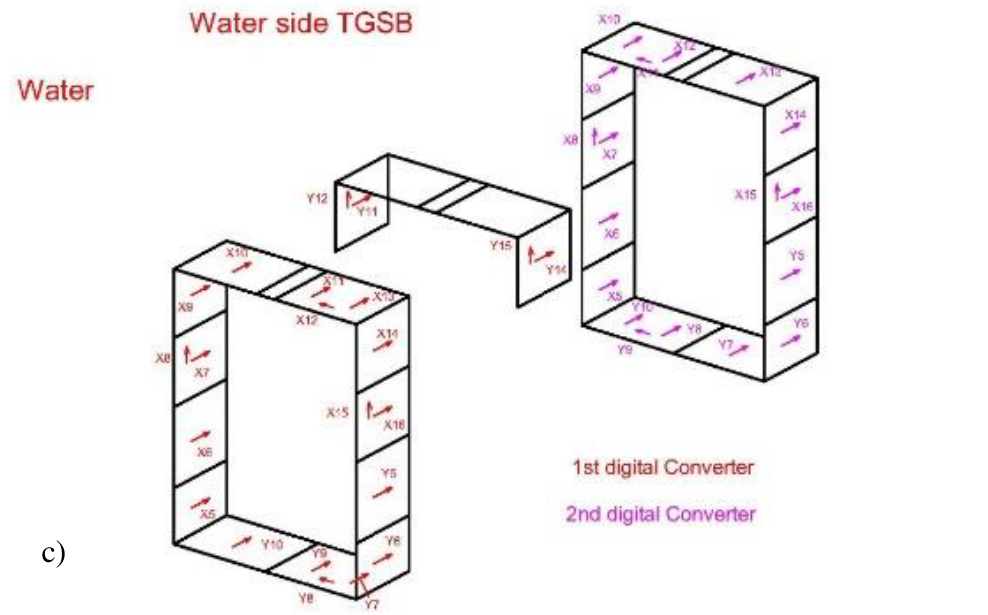
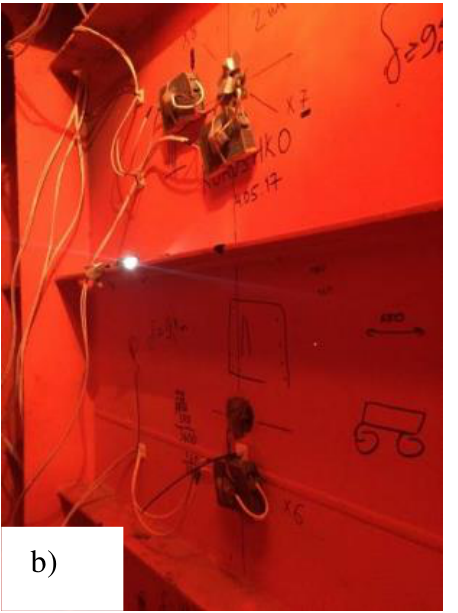
FIG. 16. STRAIN GAUGES’ POSITIONS ON BOOM, GIRDER AND TGSB
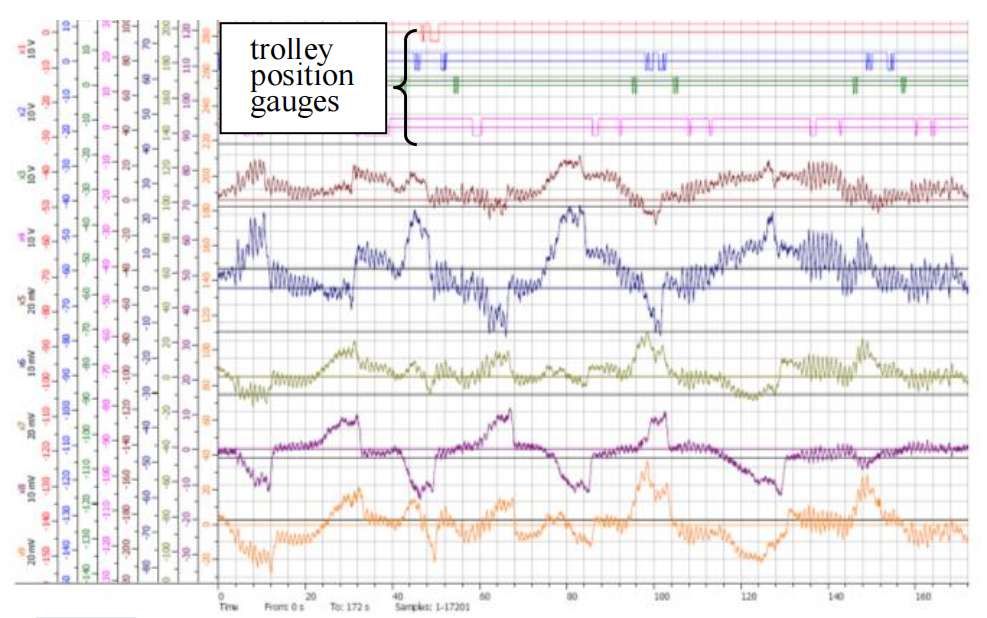
FIG. 17. STRAIN GAUGE SIGNAL SNIPPET FOR TGSB CRITICAL ELEMENT DURING CRANE OPERATION
The snippet of measured signals from the strain gauges vs time are shown in Fig. 17.
The calibration coefficient to convert measured signal in volts to strain has been taken from laboratory tests (for each channel) using the specially designed beam (Fig. 18) with varying width to provide constant strain all over its length.
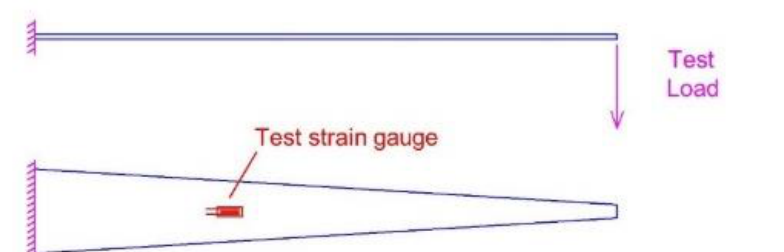
FIG. 18. BEAM FOR STRAIN GAUGE INITIAL SIGNAL CALIBRATION
For first step strain gauge signal in volts was measured for test weights of 0, 0.5 kg, 1 kg, 1.5 kg and 2 kg. Then the corresponding strain magnitudes were calculated for all applied test loads using Strength of Material approach. This allowed to plot point in strain vs voltage axes.
For second step the calibration coefficient was calculated using linear interpolation for strain vs voltage signal plot.
Using calibration coefficient Initial signal from the strain gauge (electrical voltage) has been converted to strain (Fig. 19, a; Step 1), then to stress (Fig. 19, b; Step 2), filtered out [10] and the stress cycles were extracted using Range-Pair Counting Method algorithm [11], Fig. 19.
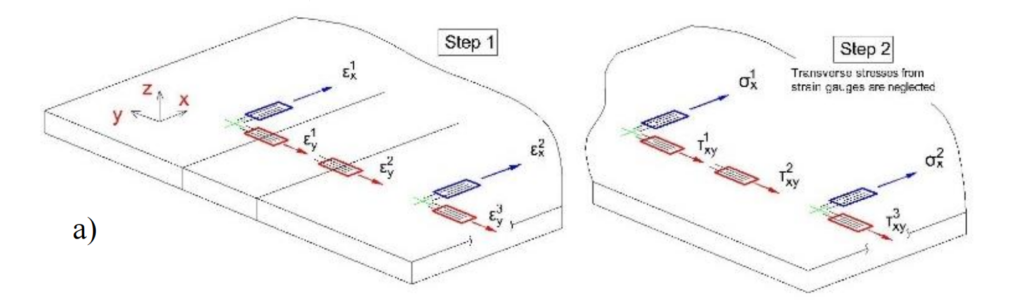
FIG. 19. MEASURED SIGNAL CONVERSION VOLT-STRAIN-STRESS
Based on the stress at the points where the strain gauges are placed the stress distribution diagram along each plate edge has been reconstructed for normal (Step 3) and shear (Step 4) stresses, Fig 20.
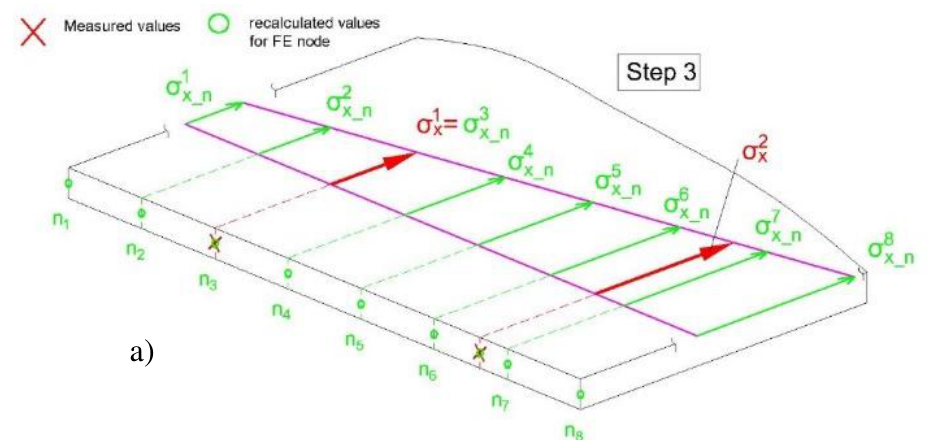
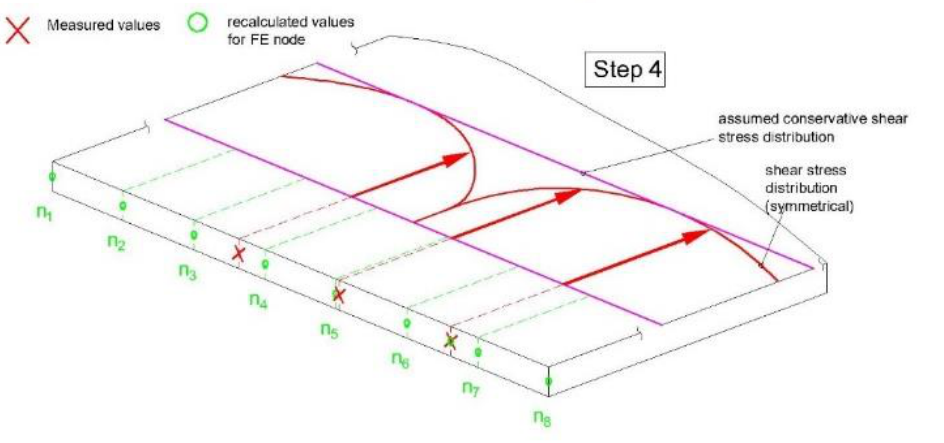
FIG 20. THE STRESS (NORMAL AND SHEAR) DISTRIBUTION RECONSTRUCTION ALONG THE PLATE EDGE
Finally, knowing number of FE along each edge, plate thickness and FE edge length, the stress to the FE edge has been converted to nodal forces, Fig. 21. In order to automatize the aforementioned steps C++ based programs and ANSYS APDL language macros have been used.
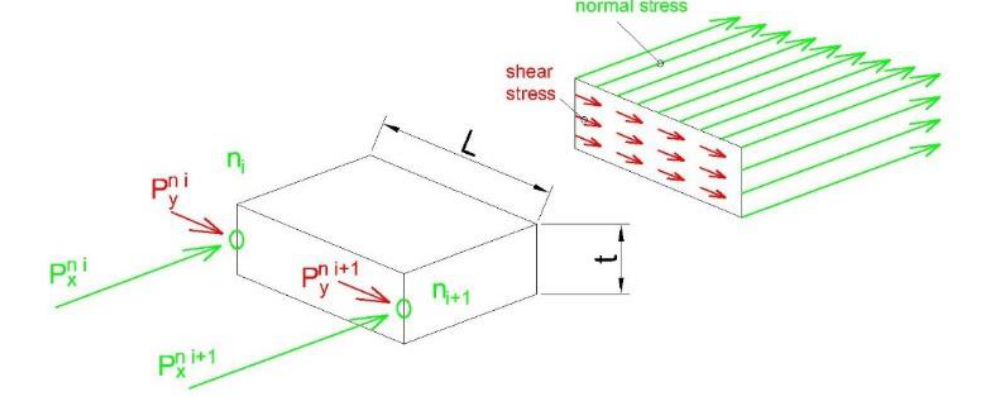
FIG. 21. NODAL FORCES CALCULATION BASED ON THE RECONSTRUCTED STRESS
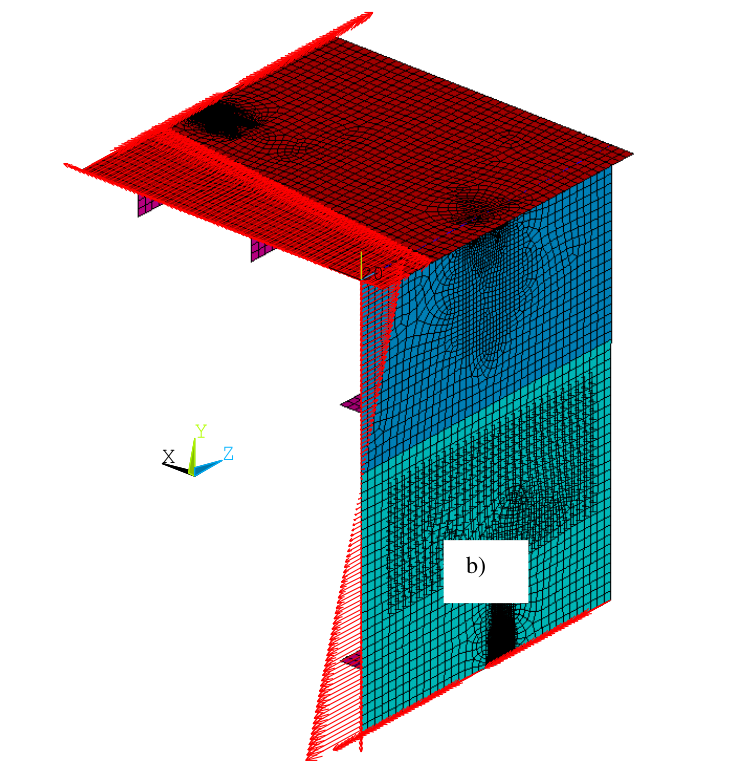
FIG. 22. BOOM CRITICAL ELEMENT WITH APPLIED BOUNDARY CONDITIONS
E. Material tests
The following material tests have been performed to find out the degraded properties of the Ship Unloader grade:
1) Uniaxial tension in order to find the possible changes of yield stress value due to the accumulated fatigue damage.
Finally, knowing number of FE along each edge, plate thickness and FE edge length, the stress to the FE edge has been converted to nodal forces, Fig. 21. In order to automatize the aforementioned steps C++ based programs and ANSYS APDL language macros have been used.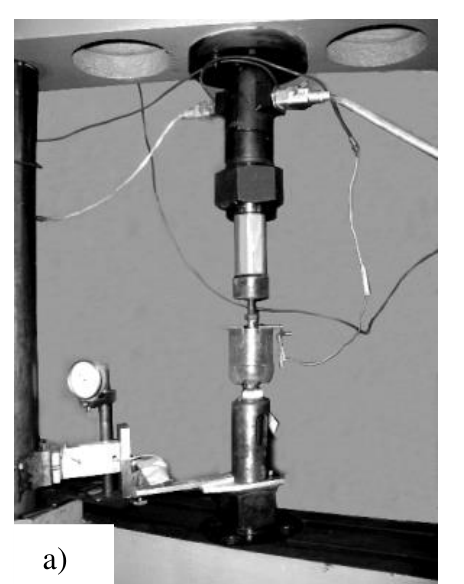
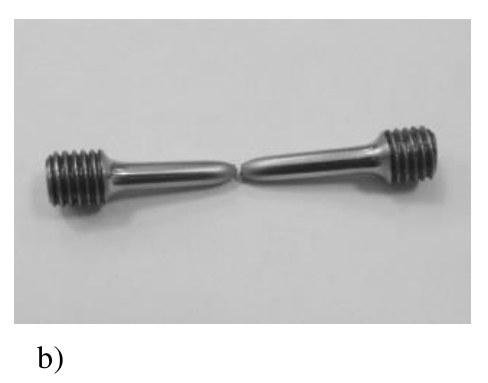
FIG. 23. UNIAXIAL TEST MACHINE AND SPECIMEN
2) Impact toughness test to find the possible embrittlement of the grade due to the accumulated fatigue damage
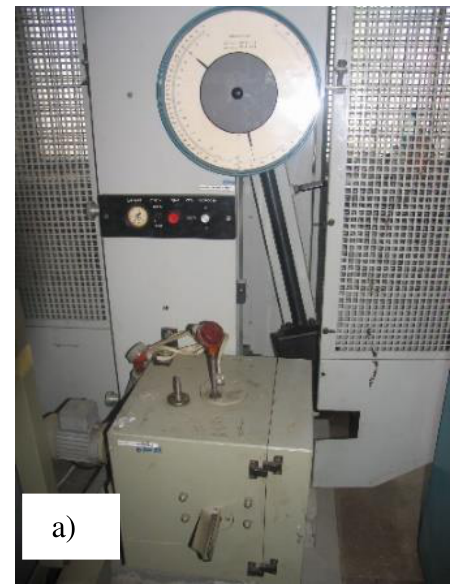
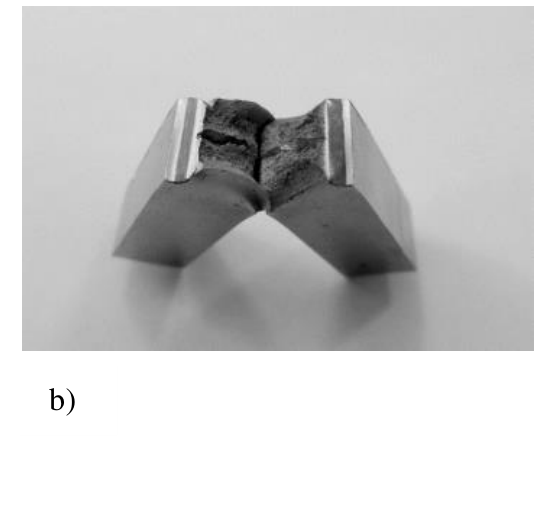
FIG. 24. IMPACT TOUGHNESS TEST MACHINE AND SPECIMEN
3) Fatigue crack growth test, to be used in the crack growth analysis for the residual life assessment
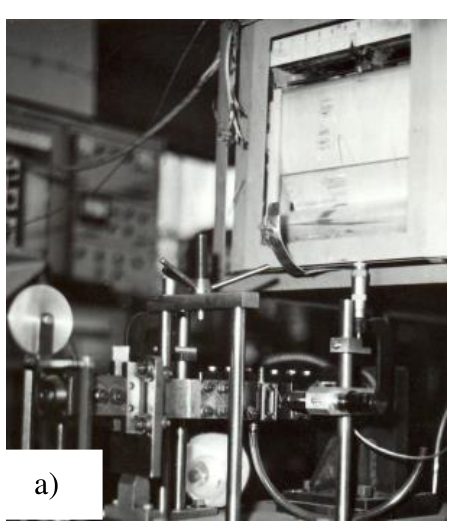
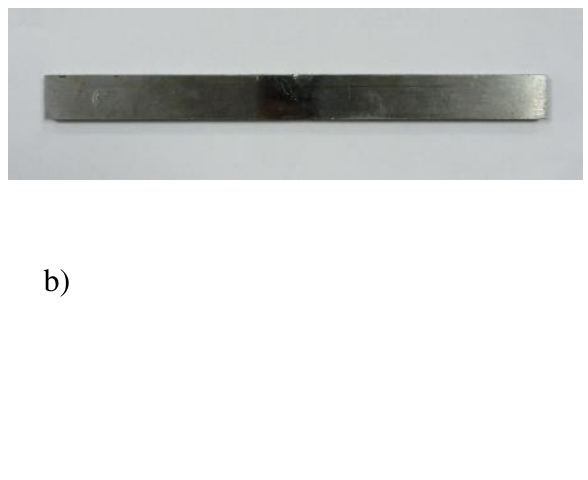
FIG. 25. FATIGUE CRACK GROWTH TEST MACHINE AND SPECIMEN
4) Fractography for all mentioned above tested specimens
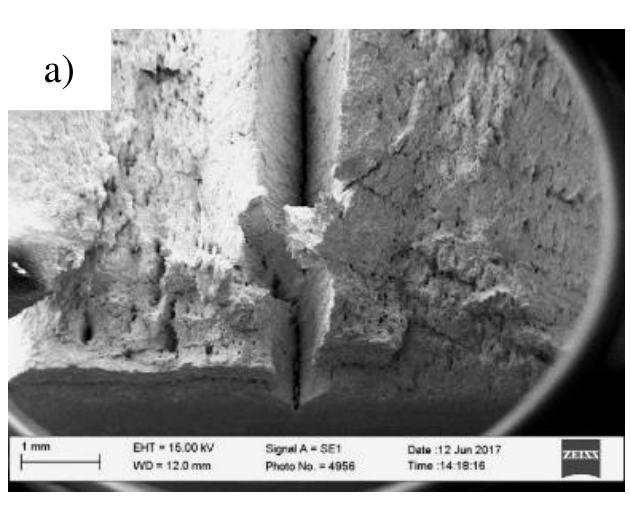
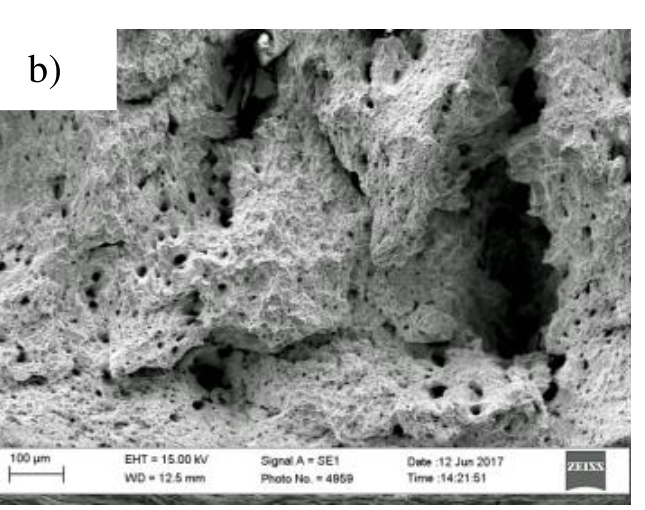
FIG. 26. FRACTURE FEATURES OF THE SPECIMEN DESTRUCTION TESTED FOR IMPACT STRENGTH (WITH DIFFERENT RESOLUTION)
It is found that
- Based on yield stress and impact toughness values there is no significant degradation of plasticity of the grade during the crane operational life.
- At the same time, fractography found a large number of deep laminations in the steel. The laminations appear due to weakened cohesion between grade matrix elements, nonmetallic inclusions etc. Those laminations significantly decrease the robustness of the crane element and could be a reason of the crane collapse due to uncontrolled fatigue crack propagation.
F. Critical elements’ residual life assessment based on crack growth FEM analysis
The residual life has been calculated acc. [12] based on linear fracture analysis, which utilizes Paris law:
where a – crack length, meters; N – number of stress cycles; da/dN – crack growth speed, m/cycle; ΔK- Stress Intensity Factor (SIF) range MPa/m0.5; m — index of power, obtained from experiment; A – coefficient of proportionality, obtained from experiment.
The cycles with SIF amplitude which is more than 0 have been considered in analysis. Also cycles with compression stress in the crack tip have been excluded.
Having analyzed all three submodels (Boom, Girder and TGSB) it was found that the element with the lowest value of the residual life is the TGSB with the critical area of the sheave support flange connection. The residual life of the unloader after repair, based on the fatigue analysis of its critical element, is approximately 9.7 years. It has been assumed that the crane will work with the same regime (same Safe Working Load, mechanisms accelerations etc.).
SUMMARY
Advantages of the approach
The proposed approach allows to perform the FEM analysis for the crane elements in the cases when the structural drawings are not available.
The measured stress contains all the information about forces that appear during the real operational process (i.e. skew load on the trolley wheels, forces from the grab swaying on ropes, dynamic forces during closing the grab etc.). This allows to calculate the residual life more accurately for the considered crane. At the same time for FEA analysis of the whole FE model those forces are unknown and are taken according to the existing standards where certain exaggerations are used to represent the crane worst operational conditions that in real life happen seldom and for the particular crane under consideration could not happen at all.
Disadvantages of the approach
The analysis could be done only for the current operational parameters of the crane. For the case when it is needed to calculate the residual life for the case of increased SWL or mechanism accelerations, the FEA of the whole crane and as the result the full package of structural drawings is needed.
REFERENCES
[1] Milana, Giulia; Banisoleiman, Kian; González, Arturo, Sources of structural failure in ship unloaders, 26th European Safety and Reliability Conference (ESREL 2016), Glasgow, UK, 25-29 September 2016.
[2] Bin Xu, Xiaoying Tang, Enpin Liu, Xiao Liang, Fatigue life assessment of steel structures of gantry crane, XXII International Conference on Material Handling, Constructions and Logistics (MHCL2017), Belgrade, Serbia, 04-06 October 2017.
[3] M. Starikov, A. Beljatinskij, Perentkovskis, and I. Klimenko. “The use of magnetic coercivity method to diagnose crane metalware,” TRANSPORT, vol. 26 (3), pp. 255-262. Sept. 2011. DOI: 10.3846/16484142.2011.622138
[4] M.A. Starikov, Nikiforov Yu. A. “Residual life assessment for the metallic structures of hoisting machines,” Strength of Materials, vol. 44(1), pp. 108-113, Jan. 2012. DOI: 10.1007/s11223-012-9355-8
[5] M. Starykov, “Methodology of residual life assessment in the metallic structures of lifting machines,” TRANSPORT, vol. 28 (3), pp. 238-243, Oct 2013. DOI: 10.3846/16484142.2013.829120
[6] Practical evaluation of fatigue and stress state, and residual life of metal by non-destructive method for measuring magnetic characteristic “The coercive force” – A case study / R. Solomakha, R. D. Pittala, G. Bezlyudko, B. V. Baskaran // Asia Pacific Conference on Non-Destructive Testing (14th APCNDT), Mumbai, India, November 18–22, 2013. – P. 1–9.
[7] Information on http://www.cae.tntech.edu/~chriswilson/FEA/ANSYS/ANSYS_LEFM02.pdf
[8] Information on https://en.wikipedia.org/wiki/Mohr%27s_circle
[9] P. Tutak, Application Of Strain Gauges In Measurements Of Strain Distribution In Complex Objects, JACSM, Vol. 6(2), pp. 135-145, Dec 2014.
[10] J. Draper, Modern “Metal Fatigue Analysis,” Birchwood Park, Warrington : EMAS Pub, 2008.
[11] “Standard Practice for Cycle counting in Fatigue Analysis,” ASTM E 1049-85 (Reapproved 1997). (n.d.).
[12] BS 7910 “Guide on methods for assessing the acceptability of flaws in metallic structures”, 1999.
AUTHORS
First Author – Dr. Maksym Starykov: graduated from Odessa National Maritime University, Faculty of Port mechanization with MSc degree. Has his PhD in material handling equipment area.
E-mail address: m.starykov@gmail.com
Second Author– Kokoshko Evgenii: graduated from Odessa National Maritime University, Faculty of Port mechanization with MSc degree.
E-mail address: kokoshko1etc@gmail.com