

Maksym Starykov, Frank Van Hoorn2
1 PhD, Mechanical Engineer, Palfinger Marine, Bergen, Norway
2MSc, Naval Architect, Argonautics Marine Engineering, Inc, Windsor, USA
Corresponding author: Maksym, Starykov, starikovmax@yahoo.com
Submitted 06.05.2016; accepted date (use style Received dates, or Alt + Ctrl + R)
Abstract. For the last decades, fully erected container cranes have been delivered to a customer site by ships. On one hand, using this method of transportation is very attractive due to its cost and time savings. But on the other hand, being exposed to cycling loads from the ship motions during the sea voyage, the crane structure accumulates fatigue damage. Using the accumulated fatigue damage parameter, the crane transportation could be associated with the amount of the working cycles the crane could have worked out during its normal operating at the customer site. In the presenting paper the research for the real case of a new crane voyage from China to Ukraine has been done.
Keywords: crane sea transportation, fatigue damage accumulation, ship motion accelerations, finite element analysis, container crane, ship-to-shore crane, STS crane.
Introduction. In general practice of lifting cranes they could be delivered from the manufacturer factory to a customer site in two different ways:
1. Statement of research problems and the technique for their decision.
The main disadvantage of the crane delivery by means of sea transportation could be understood after a closer look at the cyclic loads, which act on the carried crane from the ship motions along the whole voyage. The loads could have quite significant magnitude and amount of cycles, which leads to fatigue damage accumulation (Murakami, 2012) in the crane elements and joints. In the other words it means that after a new crane is delivered by sea to the customer site it is not a new anymore, but has a condition which is equivalent to being in operation for some time.
Of course, each transportation case is individual and the following cases are possible:
The main goal of the current research is in finding out if the delivery of the fully erected Ship to shore crane by vessel damages the crane by decreasing its service life and in the case of positive answer assess this damage in terms of working cycles. The main parameter that is checked by structural engineers on the project preparation stage is the static strength of the crane structure, lashing elements, deck of the carrying vessel and all the reinforcements. Unfortunately, investigations of the influence of a fully erected crane transportation by sea on its residual life, which involves fatigue analysis of the structure but not only static strength, have not been found. In this paper, the analysis for specific case has been done in order to assess such influence.
Thus, the novelty of the current research is in the investigation of carried crane service life decreasing due to the sea voyage based on fatigue damage accumulation assessment.
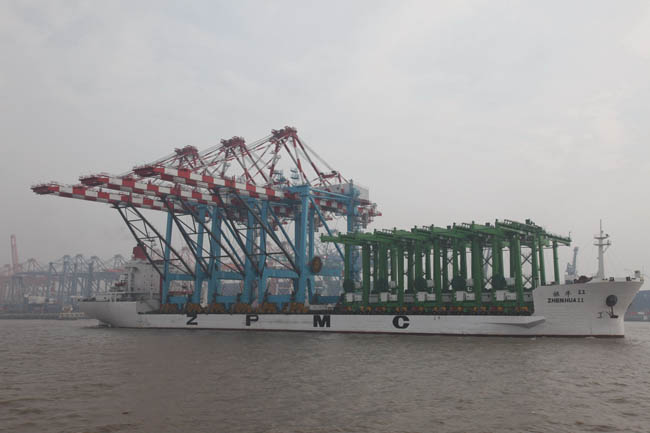
A real case of a ZPMC© quay crane delivery from China to Ukraine has been used for this analysis. The route is shown in fig.1.
 Figure 1. The ZPMC vessel route, which transports the quay crane from Shanghai (China) to Yuzhne (Ukraine). The small green squares contain the date when the ship passed the point
The basic crane (fig. 2) parameters are as follows:

Figure 2. The quay crane general arrangement. The cross section of the container carrier with the numbers of container rows are shown at the right lower corner (#1-#20)
The cranes position on the ship during its transportation is shown in figure 3.
 a) a) |
|
 b) b) |
 c) c) |
Figure 3. The crane on the ship’s deck
The analysis of the crane has been split into three major stages. On the first stage the loads on the crane structure due to the ship motions have been calculated. The second stage involves finite element analysis for crane static strength under the influence of the mentioned above loads. On the last stage, based on the obtained stress data for the crane structure during the voyage and using a specially created program, fatigue damage accumulated in the crane structure has been calculated.
2. Loads from ship motion determination
Based on the limited data available, the ZHEN HUA 11 vessel was modeled based on the hull of a standard bulk carrier, converted into the crane carrier, with identical dimensions (similar to the real – full scale – conversion) (Van Hoorn, Container crane transportation option: Self-propelled ship versus towed barge, 2005), (F. van Hoorn, Wijsmuller Transport B.V. and S.D. Devoy, Matthews-Daniel Co.,, 1990). For the computer model of the resulting hull, see figure 4 the loading condition was prepared based on the crane and RTG data, estimated lightship of the vessel, and some additional weights for bunkers, ballast, and some miscellaneous. The approximate stowage plan is presented in figure 5.

Figure 4. MOSES© model of the vessel hull

Figure 5. Approximate stowage plan
The resulting loading condition is summarized in table 1.
Table 1. Loading condition ZHEN HUA 11 with 3 STSs and 5 RTGs
| Displacement | 60,300 | T |
| Draft bow | 6.9 | M |
| Draft aft | 8.6 | M |
| GM’ | 8.3 | m |
| Roll gyradius | 13.9 | m |
| Roll period | 12.5 | s |
For the environmental conditions for the voyage from Shanghai, China, to Yuzhne, Ukraine, the Global Wave Statistics were used. A combined voyage scatter diagram was made by adding all scatter diagrams for the areas crossed together, each weighted with a transit time factor. The same wave data base also provides wave direction statistics for the individual areas crossed (N. Hogben et al, 1986) (Van Hoorn, Heavy-Lift Transport Ships – Overview of Existing Fleet and Future Developments, 2008). Combining these with the transit times (exposures) resulting in the following probability for each class of wave heading:
With the combined total voyage scatter diagram and using the MOSES© software program, the vessel motions and point accelerations at the crane CG were calculated for each wave height – wave period combination. This resulted in double significant design acceleration scatter diagrams for each of the 3 main directions. For each direction, the linear accelerations were grouped in 0.1 g interval classes and the numbers in each class were totaled, as presented in table 2. The double or full cycle significant (mean of highest 1/3) values give a good representation of the accelerations acting on the crane CG in each of the three main directions.
The loads are represented by linear accelerations along all three axis that are considered to be applied to the crane center of gravity (table 2). Total amount of oscillations is 461 000, cycle time is 10 seconds.
Table 2. Accelerations applied at Center of Gravity of the crane structure due to the ship motions
| Acceleration range in units of “g” | Longitudinal acceleration oscillations (total)* | Lateral acceleration oscillations (total)* | Vertical acceleration oscillations (total)** |
| 0.0 – 0.1 | 459,324 | 345,259 | 424,125 |
| 0.1 – 0.2 | 1,676 | 77,234 | 33,430 |
| 0.2 – 0.3 | – | 26,347 | 3,292 |
| 0.3 – 0.4 | – | 7,867 | 148 |
| 0.4 – 0.5 | – | 3,443 | 5 |
| 0.5 – 0.6 | – | 549 | – |
| 0.6 – 0.7 | – | 209 | – |
| 0.7 – 0.8 | – | 59 | – |
| 0.8 – 0.9 | – | 32 | – |
| 0.9 – 1.0 | – | 1 | – |
* – includes static part
** – excludes static part 1g
For the crane structural analysis, its model with lashing elements has been created (fig. 6).
3. Model description
The crane model has been prepared using ANSYS© utilizing finite element approach for stress calculation (Madenci, E., Guven, I, 2006), (Arsian, 2015), (Stolarsky, T., Nakasone, Y., Yoshimoto, S., 2006). The following finite elements have been used (fig. 6):
BEAM – for modelling of crane main elements (as legs, girder, boom, A-frame, stays etc.) and reinforcement structures (as boom support and crane four corner additional supports).
LINK – for lashing ropes. Initial pretension (2 tones) in each rope has been modelled.
MPC – for modelling of joints with only rotational degree of freedom. In order to model the saddle pin behavior the boom-girder joint has been modelled with the rotation restrictions.
MASS – for modelling attached elements masses, as machinery, trolley rails, ladders and platforms, elevator etc.

a) the beam model with shown beam element sections

b) crane skeleton model (beam sections are turned off)
Figure 6. The crane finite element model
The linear model of a material behavior has been chosen with Young modulus of Pa and Poisson ratio of .
The model loadings have been applied during two phases: preparatory loading steps and main loading steps.
The first preparatory loading step corresponds to the quay crane situated on the ship deck just after its disposal. It means there are neither supporting nor reinforcing structures installed yet (fig. 7). The crane structure has been loaded by its self weight and prestressed lashing ropes. Under the applied forces the structure had the initial deformation. The crane support structures (boom propping frame including two lashing wire rope that connect middle of the frame with the boom; supporting tubes at all 4 corners of the gantry) have also been modelled on the first stage, but turned off using birth/death element technology.
On the second preparatory loading step, the crane support elements have been turned on (fig. 8), and started propping the initially deformed crane structure. The main point of the splitting the preparatory loading into two steps is to model real situation, when the support elements have been applied to the deformed crane structure and therefor the only stress that could appear in the reinforcement comes from ship motions and reinforcing elements self-weight.
The boundary conditions for the crane attachment to the ship deck modelling are shown in fig.9.

Figure 7. Crane structure considered on the first preparatory loading step

Figure 8. Crane reinforcement elements, turned on the second preparatory loading step

Figure 9. boundary conditions, applied to the crane structure at first and second phase
During the second phase the loading cases that represent the structure loading with acceleration (according to the table 2) due to the ship motions have been created (PADT and Jeff Strain, 2013). For each acceleration class two loading cases have been created with acceleration acting in two opposite directions. As far as the number of cycles are given for the acceleration range, in calculation the mean value of the acceleration class range has been used.
For instance, for the longitudinal acceleration class 0.2 – 0.3 g the mean value range of 0.25g has been taken and two loading cases have been created, first one with acceleration of +0.125g and the other with -0.125g. Subtracting the second loading case from the first one gives the loading case with the stress range in the crane structure.
In addition to the stress information for the further fatigue analysis, the information regarding structure elements fatigue classification (FAT class) (Draper, 2008) is needed. For this purpose the FAT class has been assigned to all elements of the crane main structure (fig.10).

a)

b)

c)
Figure 10. Elements with assigned FAT classes
For the last phase of the analysis the special program has been created (Stroustrup, 2014) that uses the external information about structure elements FAT classification and the stress for loading cases for input data. The algorithm of the program is shown in fig. 11.
The program utilizes the nominal stress approach acc. (BS EN 13001-2:2014 Crane safety. General Design. Load actions, 2014), (Hobbacher) and Palmgren-Miner cumulative damage rule (Jean Lemaitre, Rodrigue Desmorat, 2005), (Chaminda, 2015).

Figure 11. Customer fatigue analysis program algorithm
The result of the program operation is the information about accumulated fatigue damage in each element.
Basic assumptions, used in the program algorithm, are as follow
According to the recommendations for the fatigue analysis (Hobbacher) the critical accumulated fatigue damage value is 0.5 and according (FEM 1.001. Rules for the designing of hoisting appliances. 3rd edition, 1998) it is 1.0.
The results of the fatigue damage accumulation (Lee, 2005) for the crane exposed to longitudinal, vertical and transversal accelerations are shown in fig. 12 and 13. The maximal accumulated fatigue damage D of the range from 0.1 to 0.05 has been found in the boom diagonal beam (fig.12). The fig. 13 shows the elements with the maximal accumulated fatigue damage from 0.05 to 0.025.
 Figure 12. Elements with the maximal accumulated fatigue damage from 0.1 to 0.05 (boom diagonal, shown in red)
 a) a) |
 |
b) |
 |
c) |
Figure 13. Elements with the accumulated fatigue damage from 0.05 to 0.025 (shown in red)
The fatigue analysis shows that during the crane transportation on the deck of the ship the crane structure has been damaged by the loading cycles, initiated by the ship’s motions. Using the accumulated damage values the crane transportation could be associated with the amount of the working cycles the crane could have worked out during its normal operating at the customer site (table 3).
Table 3. Crane transportation association with its normal operation
| Critical Elements with accumulated fatigue damage and as the result decreased service life due to the transportation | Calculated Damage, accumulated during the sea transportation, Di | , Crane element’s life (maximal) lost during the crane transportation, based on critical value of fatigue damage D=1* | Crane element’s life lost (maximal) during the crane transportation, based on critical value of fatigue damage D=1, working cycles** | Crane element’s life (maximal) lost during the crane transportation, based on critical value of fatigue damage D=0.5 * | , Cran’e elements life (maximal) lost during the crane transportation, based on critical value of fatigue damage D=0.5, cycles *** |
| Boom diagonal beam, fig 9 | 0.1-0.05 | 10% | 200,000 | 20% | 400,000 |
| Leg parts, portal diagonals, lower TGS beam, sill beam, | 0.05-0.025 | 5% | 100,000 | 10% | 200,000 |
* the calculation is done
** assuming crane life of 2 million cycles, crane element lost life is
*** assuming crane life of 2 million cycles, crane element lost life is
Of course, not all elements that have accumulated fatigue damage are critical from the fatigue point of view for normal operation. The good example is the boom diagonal, which is almost not loaded during the crane normal exploitation.
4. Discussion of the obtained results
According to the obtained results of the fatigue damage calculation, accumulated during the crane transportation by sea, it appears that up to 20% of the crane life has been used during its transportation. The crane that came down to the customer’s port was not the new crane, but already “used”. The fact the crane had lost such significant part of its structure life could give the customer some negotiation freedom in terms of either price reduction, increasing the warranty period or the other options.
For different cases of sea transportation such discussions between the manufacturer and customer should be based on the analysis, which could be similar to the one, shown here.
The performed analysis has been done based on accelerations of the ship, obtained from the computer modelling based on Global Wave Statistics (N. Hogben et al, 1986). The computer analysis very often gives overestimated results (Van Hoorn, Container crane transportation option: Self-propelled ship versus towed barge, 2005) and for more precise fatigue damage accumulation in the crane structure the strain measurement technic during the whole voyage could be used.
For this case before the voyage, the fatigue analysis should have been done in order to find the possibilities to minimize the accumulated fatigue damage by proper transportation plan (lowering down the CG of the whole crane by partly dismantling boom, girder and/or A-frame). The best transportation scheme is the one, for which the ship accelerations induces in the crane structure stresses with amplitude less than the endurance limit and the fatigue damage does not accumulates. Instead of this the manufacturer of the crane applied to the structure some reinforcements, but their positions and amount were decided from static strength point of view and that have not prevent fatigue damage accumulation.
5. Conclusion
6. References
Arsian, M. (2015). Hands on Applied Finite Element Analysis Application with ANSYS.
BS EN 13001-2:2014 Crane safety. General Design. Load actions. (2014).
Capitan, A. B. (1989). Use of Metereological Information for Warranty Surveying Purposes. The Nautical Institute, London.
Chaminda, B. (2015). Fatigue Damage Assessment of Steel Structures and Components. Lambert Academic Publishing.
Draper, J. (2008). Modern Metal Fatigue Analysis. EMAS Publishing.
FEM 1.001. Rules for the designing of hoisting appliances. 3rd edition. (1998).
Hobbacher, A. (n.d.). Fatigue design of welded joints and components XIII-1539-96/XV-845-96.
J.Verschoof, I. (2002). Cranes – Design, Practise and Maintenence. Proffesional Engineering Publishing.
Jean Lemaitre, Rodrigue Desmorat. (2005). Engineering Damage Mechanics: Ductile, Creep, Fatigue and Brittle Failures. Springer.
Lee, Y.-L. J. (2005). Fatigue testing and analysis. Theory and practice. Elsevier.
Madenci, E., Guven, I. (2006). The Finite Element Method and Application in Engineering using ANSYS. Springer.
Martin C, P. (2004, July). West Coast Gantry Cranes: The Path of Paceco and ZPMC. Pacific Maritime.
Murakami, S. (2012). Damage Mechanics. A continuum Mechanics Approach to the Analysis of the Damage and Fracture. Springer.
PADT and Jeff Strain. (2013). Introduction to the ANSYS Parameter Design Language (APDL).
Stolarsky, T., Nakasone, Y., Yoshimoto, S. (2006). Engineering Analysis with ANSYS software. Elsevier.
Stroustrup, B. (2014). Principles and Practice Using C++. Second Edition. Eddison-Wesley.
Van Hoorn, F. (1991). Design Criteria for Self-Propelled Heavy-Lift Transports – And How Theory Theory Correlates with Reality. Second Offshore Symposium on Design Criteria and Codes. Huston, TX.
Van Hoorn, F. (2005). Container crane transportation option: Self-propelled ship versus towed barge. Rina Conference on Marine Heavy Transport & Lift. London.
Van Hoorn, F. (2008). Heavy-Lift Transport Ships – Overview of Existing Fleet and Future Developments. MOSS 2008 conference. Singapore: MOSS.
In the paper in terms of repairing of RTG the necessity of using a state-of-the-art CAD and CAE programs by companies which are engaged in crane repairing and modernization business is shown.
Key words: RTG crane, crane metal construction repair, cargo lifting machines.
Methods of problems solution, which should be done during normal engineering practice, are not always similar. Especially when the repairing or modernization of cargo lifting and conveying machines is done, with involving its basic features changing, like speed, safe working load (SWL), outreach etc.
Even the using of a common repairing method is not always able due to different bounding conditions. That is why the necessity of appropriate solution idea for every certain problem arises. For the transition from an idea, which result is just a sketch of future changes in the crane, to drawings creation it is needed to determine the necessity of existing crane metal construction joints reinforcement, fulfill their strength assessment or changes in the metal construction, perform verification for the whole reconstructed machine (strength, stability, fatigue etc.). On the next stage the resulting information, obtained after strength assessment (joints that are needed to be reinforced, types of reinforcements, thickness of metal sheets etc.), is passed for the drawing creation. And based on the drawings the whole work is done.
Thus, described above succession is basic set of actions for repairing works or modernization. And the company, which performs this works, must have highly qualified specialists with not only a significant experience, but strong knowledge of strength calculation, designing and site work execution. However many people disparage the up-to-date computing programs and prefer them simple hand calculation, based on strength of material. Nevertheless they usually forget that the main task for an engineer is not just getting a result using programs or hand calculation, based on simplified theories, but analyze the derived result, assess the error ability in the calculation, compare with the results for the similar objects received in previous projects.
As an example for application mentioned above work succession the repair of the RTG crane in PSA (Singapore) is shown. This crane is used for yard operations at container terminals. The work was fulfilled by PORTEK System & Equipment Pte Ltd – the leading company in the port business.
During accident-free exploitation of such cranes owners are usually faced with the similar problems: span increasing due to the deformations of main girders and legs and main girders maximal deflection changing. According to norms of crane exploitation the maximal deflection does not have to be bigger than a certain value that is proportional to the crane span. The span tolerance is shown in the crane drawings.
According to the RTG survey measurement before commencement of repairing work maximal deflection of main girder was 28 mm with trolley in the middle of the main girder without container. At the same time maximal permissible deflection have not be more then 32 mm for the trolley in the middle of the girder with a testing weight. Span increasing was 280 mm.
Due to a repairing procedure the RTG crane (fig. 1) was lifted up for 0.5 meters above ground level (fig. 2) and put onto the lattice repairing tower (fig. 3) that was mounted from below of it. Main lattice elements, pillars, are made from tubes.
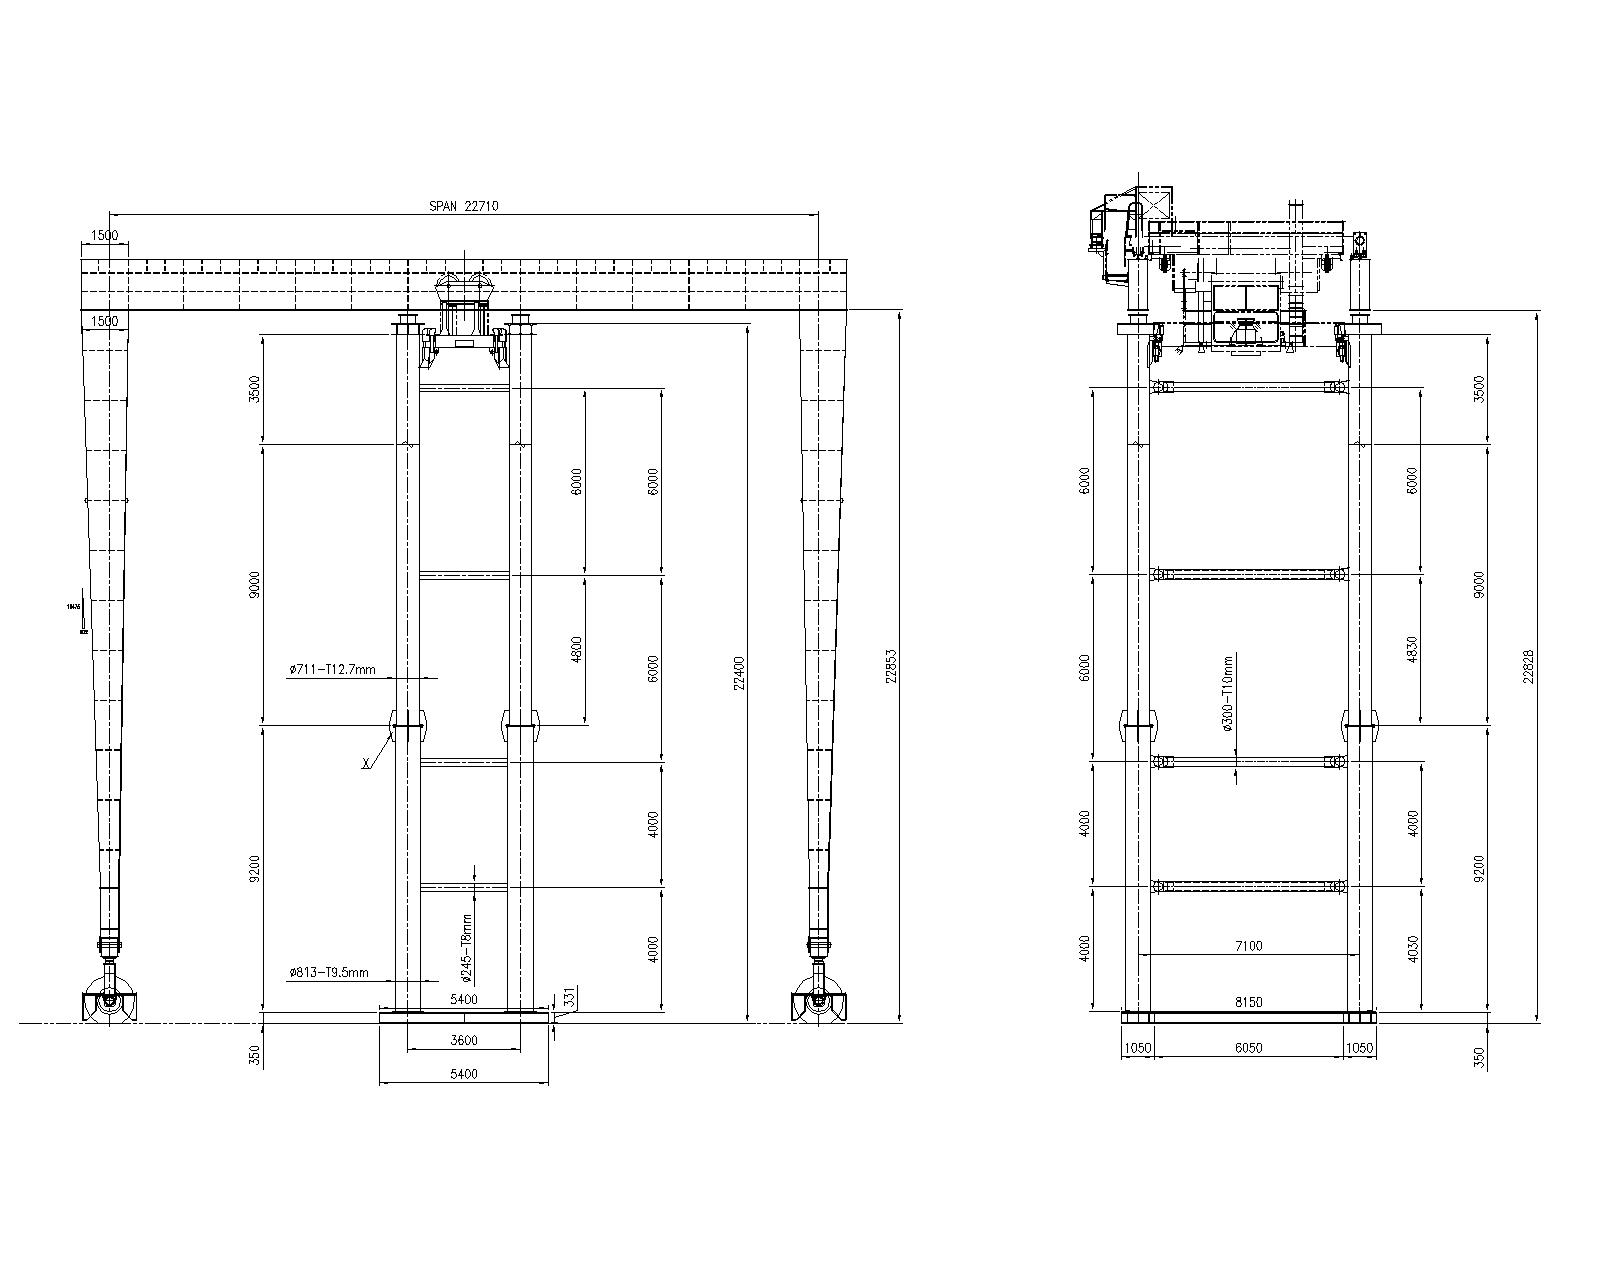
Figure 1. The main view of the RTG crane, mounted on the repairing tower
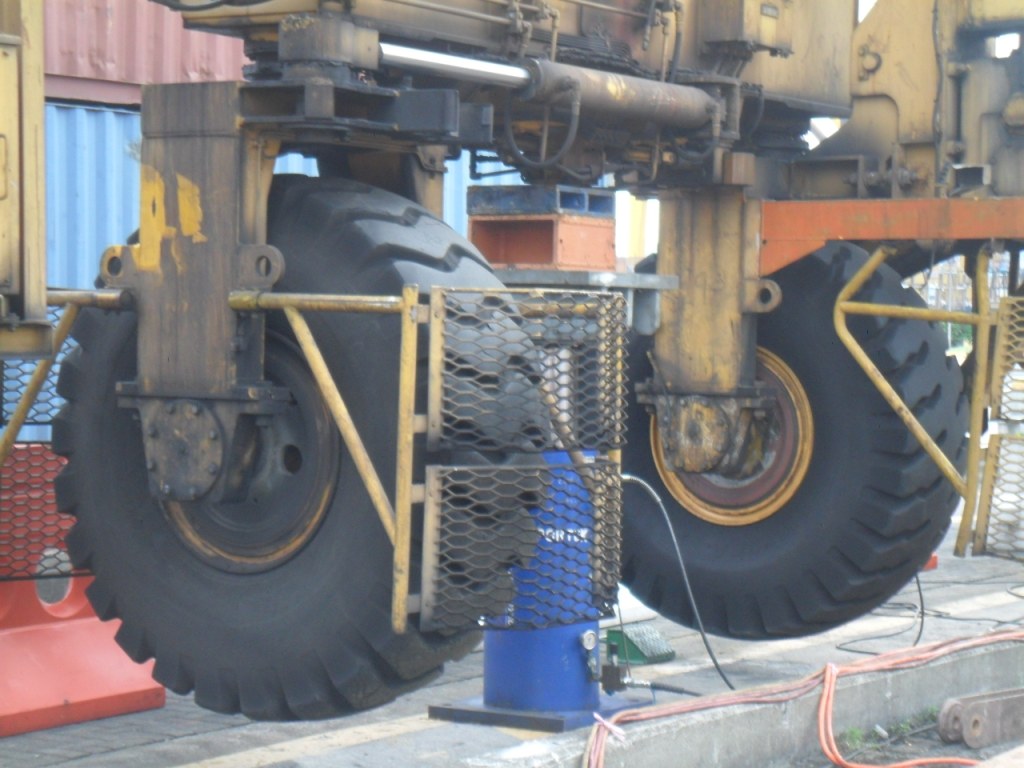
Figure 2. The RTG crane lifting for mounting the repairing tower below it
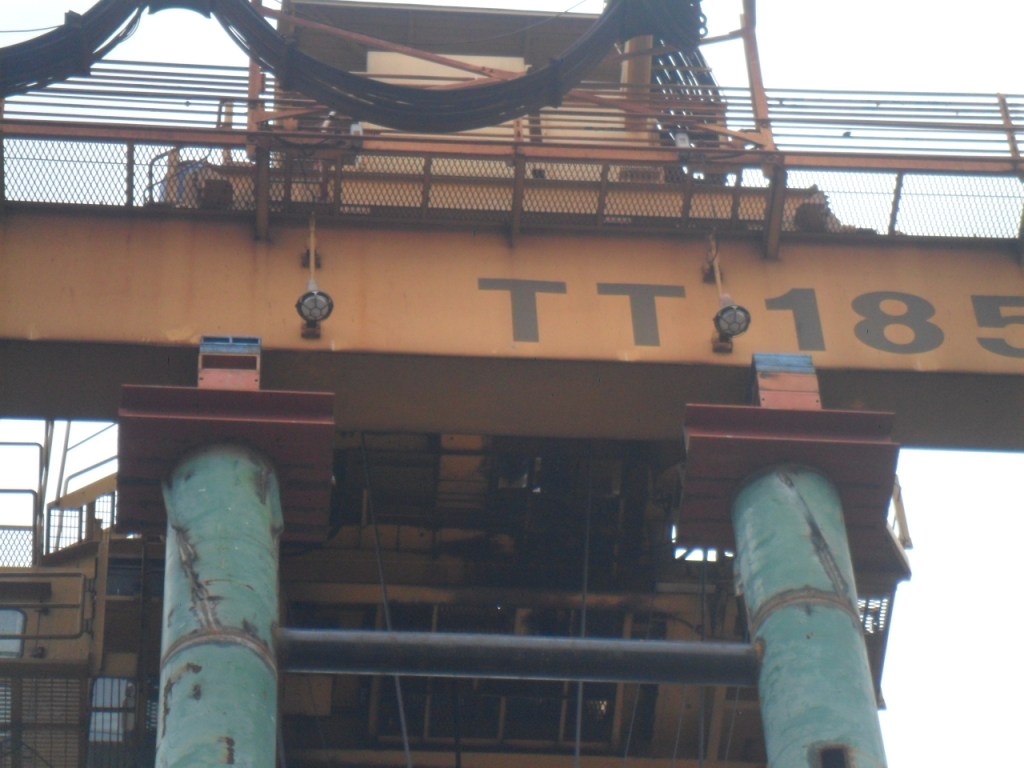
Figure 3. The RTG crane main girder resting on the top of the repairing tower
Before the work commencement the finite element analysis of the repairing tower was performed. The calculation was done to assess tower strength, stability as a lump construction and its pillars buckling. During calculation the tower was undergone to the vertical forces of the RTG weight and horizontal wind forces to the RTG and the tower. Also the unsymmetrical load on tower pillars was considered (fig. 4).
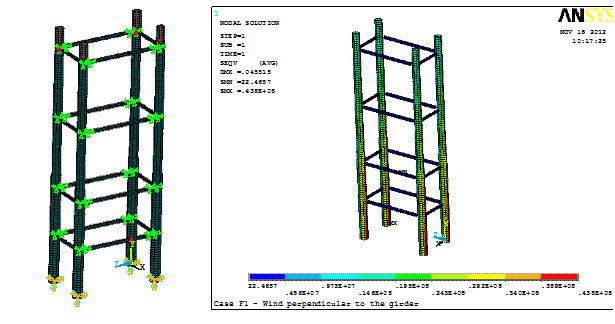
Figure 4. Boundary conditions and calculation results (equivalent Misses stresses) for repairing tower
For main girder deflection improving it was decided to use its heating, which is the typical method for similar cases. But the customer refused this method to be applied. The reason is possible girder deformation not only in a vertical, but also a horizontal plain. As a result it was resolved to use plastic deformation of the main girder during pulling the RTG crane legs together for its deflection improving. Calculation was done for determination of the minimal forces, which should be applied to the RTG legs, to put material in the middle of the main girder to plastic state (fig. 5 and fig. 6). After main girder deflection decreasing the main girder was reinforced by additional plates that were welded to both its sides.
Figure 5. Boundary conditions for the RTG crane, which is situated on the repairing tower
Figure 6. Von Misses equivalent stresses for the RTG crane on the repairing tower with horizontal forces applied to legs
For easier and more precise crane span restoration, in the joints of legs with main girder the separation of three leg plates from girder was performed (fig. 7) for each joint of leg-girder connection. Leg pulling was done by horizontally disposed jacks.
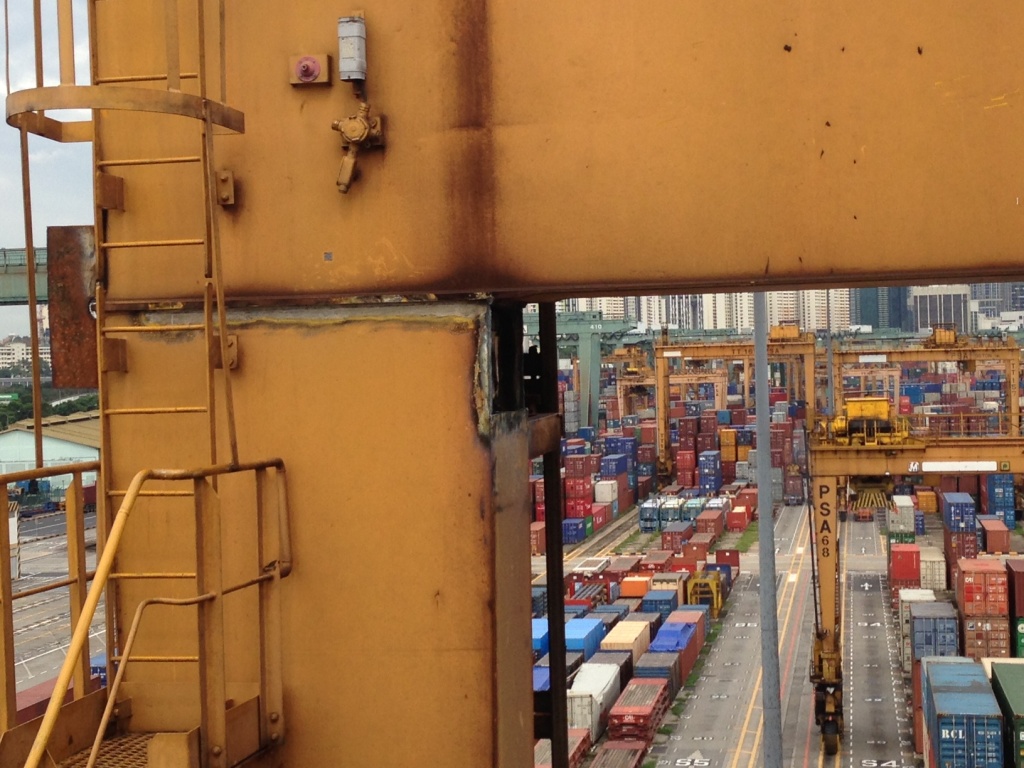
Figure 7. Disconnection of three leg plates from the main girder
After finishing span restoration the leg-girder connection was renewed and additional gusset plates were attached (fig. 8).
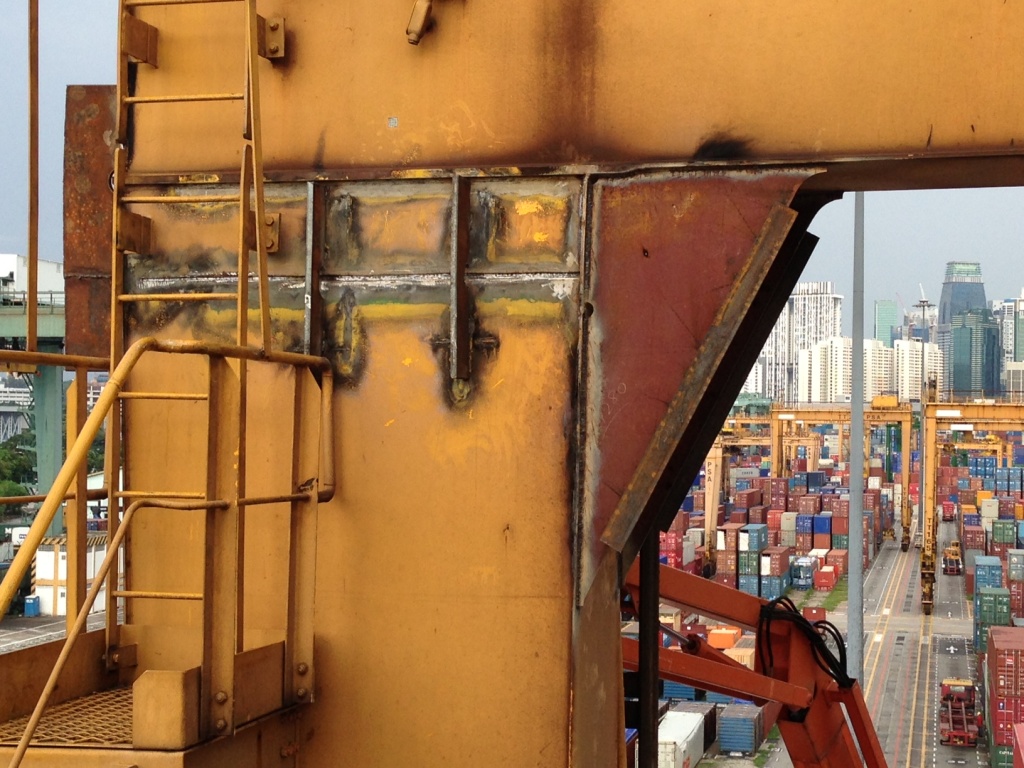
Figure 8. Leg-girder joint reinforcement (before final adjustment and painting)
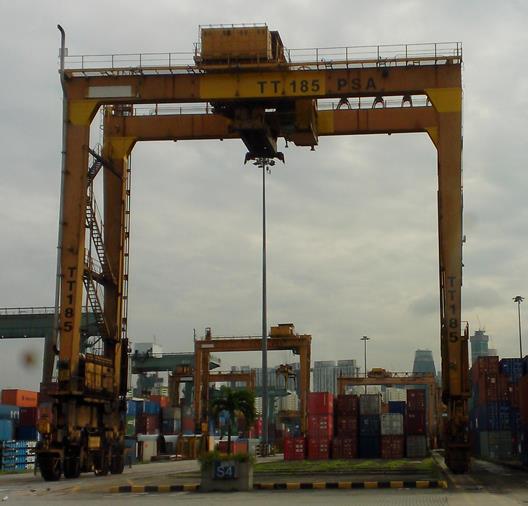
Figure 9. The RTG crane after repair
Below the measurement results after repairing are showed:
Conclusion
Using state-of-the-art programs for calculation and design in crane business is not something unusual any longer, but becomes necessary tool in engineering daily procedure of crane repairing, designing and modernization. It allows with more precision determining the conditions of metal to transfer into plastic state, calculate temperature stress, local stress in element joints, which can not be determined using common approach, based on “Strength of material” hand calculation. Although the common succession for repairing or modernization is still the same: main idea creation – strength analysis – drawings creation – execution phase, but due to the more precise modeling of stress distribution inside joints and thus a better loading process understanding inside them the overall work quality becomes much higher.
Maxim Starikov1, Andrey Beljatynskij2, Irina Klimenko3
1Dept of Hoisting machines and mechanization of cargo handling works, Faculty Mechanization of ports, Odessa National Maritime University, Philatov str. 45 app. 24, Odessa, Ukraine
2Dept of Airport Reconstruction and Automobile Roads, Institute of Airport, National Aviation University, Kosmonavta Komarova ave 1, 03680 Kiev, Ukraine
3Dept of Economics, Natonal University of Transport, Suvorova str.1, 01010 Kiev, Ukraine
E-mail: starikovmax@rambler.ru, beljatynskij@mail.ru, kirak76@mail.ru
Abstract. Currently the problem of estimating the residual life of metal structures for lifting equipment is actual, since more than 90% exhausted its regulatory resources. In this paper we propose an approach to solving this problem by using the coercive force. It is shown that to determinate a damage of dangerous element of crane it is needed to know not only a coercive force but a stress. Mathematical model is proposed to determine the damage of metal ware.
Keywords: residual life, lifting machines, the coercive force, fatigue damage of metal.
The problem of exploitation of hoisting machines with expired service is the most urgent problem for operators and their organizations. Park handling equipment hopelessly aging, and purchase of new machines made with single samples. Such a situation exists in almost all post-Soviet states as a result of violations of the centralized supply of new cargo handling equipment at ports and on the enterprises of the country. Only in Ukraine, from 95 thousand operated hoisting machines, registered with Gosgorpromnadzor, over 68 thousand have developed their own regulatory resource. According to the expert technical center for the gantry crane DIALAB “average age of cranes in the ports of Ukraine is 26.3 years, the average degree of deterioration of the park in the industry – 95,2%. The most worn park cranes – in Ilyichevsk Commercial Sea Port (average age 32.3 years cranes); the youngest – in the southern port (average age 15.6 years). The average age of cranes in the port of Mariupol is 23 years, which is twice their standard life. This situation is exacerbated by the fact that the company did not buy a new cargo handling equipment, as previously used. Thus, according to Gosgorpromnadzor Ukraine in 2007, out of 100 purchased by construction companies cranes, only 18 were new. Fundamental change in the next decade is not expected, since the replacement of all lifting equipment with an expired service to the new – a serious problem that requires huge investments in the industry.
Further operation of cranes with an expired service without proper justification professionals is an increased risk of emergency situations and is not allowed according to (Ukrainian Standard НПАОП 0.00-1.01-07). Due to the lack of renewal of the handling equipment becomes necessary to bring into operation handling machines, which exhausted their normative life. Such decisions must be justified, after expert survey and a full technical examination. Due to the fact that the design of crane steel were laid significant safety factors, the dominant defect is the loss of physical properties of metals (embrittlement, changes in the endurance limit, yield strength, reduction of impact strength, etc.) To determine the extent of degradation of the physical properties of the metal used destructive methods of control (Школьник, 1978)(tests of samples taken from dangerous metal sites). Said method has significant drawbacks: a violation of the integrity of the metal, weakening of dangerous places by repair welding, the additional costs for repairing and so on. As an alternative method of destructive testing in recent years suggest methods of nondestructive testing: the control of the coercive force, acoustics, emission control, control by setting the hardness of the surface layer of metal and so on. The main requirement for the application of any parameter during the nondestructive testing is its large, monotonic change in the accumulation of damage. Known to date research (Болотин, 1984; Пустовой, 1987; Котельников, 2005; Лебедев, Музыка, Волчек, 2002; Петрова, 2009; Прохоров) have the following disadvantages:
2.1. Analysis of existing scientific research to assess the current state of metal and prediction of its residual life.
Current diagnostic methods can be divided into two major groups – the destructive and nondestructive testing.
Destructive testing methods require excavation of the metal from dangerous metal places with the subsequent manufacturing of samples for testing (tensile, impact toughness, fatigue, etc.).
Methods of nondestructive testing studies suggest metal without recesses of his metalwork.
For the diagnosis of handling machines is more appropriate non-destructive testing, since after his execution metalwork
does not require any repair welds, which weaken the metal structure. And one more important aspect is that the tests are not enough of a sample (for example, to construct the fatigue curve of the metal should be 30-45 samples). In this case, it might happen, you need all the studied object is fully used to prepare samples, which is impossible from a practical point of view.
The main drawback of most current at the moment regulations for assessment and determination of residual life of metal structures for lifting equipment is the use of such physical and mechanical properties of the metal, whose definition is carried out only by destructive testing (testing of samples of metal hoisting machine tension, cyclic strength, toughness etc.) (Березин, 1990).
At the present time to determine the technical state of the object using the physical and mechanical characteristics [50], which vary for the same metal depending on operating conditions. These include:
Distinguish the following methods for determining the physical and mechanical properties – acoustic, electromagnetic (eddy current), radiation, magnetic, electrical, etc.
The main disadvantage of direct application of these techniques – the need for initial information about the location of the most intense metal valve assemblies to assess their condition, the use of expensive devices for work, bringing to the work of highly skilled engineering staff.
The main directions of research on assessment and prediction of residual life of welded steel structures:
2.1.1. The method of witness samples
Samples from the same metal as the metal structure itself, mounted in the most loaded nodes. In this case, damage of the samples collected faster (due to the structural characteristics of the sample) than in the base metal. Faulty witness samples indicates accumulation at the site a certain degree of damage (Конаков, 2006).
By erosion we mean the value that determined by the formula: where n – the current developments in cycles; N – time between the cycles to failure. Such a definition corresponds to a linear damage accumulation theory. In this case, the initial moment of time D = 0, and the final D = 1.
2.1.2. The method of integral-type sensors
Same as above, but the role of witness samples carry a film of lead or aluminum (Москвин, 2006; Троценко, 2007), which are mounted in the most dangerous areas of metal. As a result of microshear leading to the accumulation of fatigue damage, the metal sensor in the sensor leads to irreversible deformation, a change in the microstructure of the sensor. The accumulation of damage in the sensor is much more intense than in the metal of metal-structure. As metal films assess the extent of damage accumulated in the metal. The main disadvantages of this method are:
2.1.3. Magnetic method (of the coercivе force)
Based on the experimentally established dependence between the values of coercive force in the metal and the degree of damage to the metal. The method is relatively new but rapidly developing. One of the first papers on the application of the method to the steel grades used in crane construction was (Прохоров), which investigated the dependence of the parameters of the hardness of the surface layer of welded specimens and the coercive force of the accumulated damage to 09G2S and VSt3sp5. Metal samples were prepared microsections. Since in most types of metal elements are connected by an automatic welding, the samples were made from two sheets connected by a butt weld with its subsequent processing. For the full study examined the properties of the base metal, metal heat-affected zone and seam metal itself. For damage accumulation in metal applied static tensile test and cyclic loading in low cycle fatigue. The degree of accumulated damage estimated by the ratio of the actual number of cycles to the number of cycles to failure.
As a result of experience, we found that there is a decrease of coercive force in all three zones in the accumulation of damage in the metal.
The results obtained are certainly of value, although they were obtained for the field of low-cycle fatigue. However, their application to the field of industrial machines requires further investigation, since the steel lifting machines operate in the zone of high-cycle fatigue under the plan, samples were cut across the rolling, but according to (Ukrainian Standard ГОСТ 7564-97) sampling for determining the mechanical properties must be carried along rolled steel, which significantly affects the results of the experiment.
One of the recent work in this area is (Котельников, 2007), the main provisions of which are furnished in (Ukrainian Standard МВ 0.00-7.01-05). To assess the extent of damage of the metal is suggested to use coercive force (Ukrainian Standard ГОСТ 30415-96), because it is sensitive to changes in the structure of the metal. It is shown that the coercive force depends on: the dislocation density, grain size, the number of inclusions per unit volume of plastic deformation, internal stresses. Achieving the coercive force certain value (depending on the brand of metal) testifies to its limit state. The error associated with the spread of the chemical composition of the steel makes for St3 ± 0,3 A / cm for 09G2S – ± 0,5 A / cm(Котельников, 2007). Unlike other methods (method of strain measurement, the method of photoelasticity, etc.), the magnetic diagnostics by the coercive force reacts to the restructuring occurring residual stresses, mounting tension. As a result of accumulated damage to the coercive force changes its value throughout the life of a structural element, regardless of the conditions and methods of loading. Noted that as a satisfactory weld connection status can be evaluated according to criteria of the magnetic control of the base metal at a distance of 10 to 15 mm from the weld seam width less than the distance between the poles of the sensor. With a wide weld control the coercive force is carried out separately – first by the base metal at a distance of 200 mm from the seam, then the immediate vicinity of the weld and finally at the weld centerline. It is shown that the initial value of coercive force in the weld is higher than in the base metal. However, in the base metal damage accumulation processes run faster and destruction occurs at the same values of coercive force.
Disadvantages:
Option of coercive force is sensitive to the residual and assembly stresses. This fact is valuable, since no computational methods, nor the majority of experimental methods (eg. strain gauge experiment) can not determine the existence of a metal, residual stresses and their magnitude.
According to(Ukrainian Standard МВ 0.00-7.01-05), the coercive force in the accumulation of damage must rise, but the results of (Прохоров) contradict this assertion, that raises the need for more research in this direction.
2.1.4. The method, based on the experimentally established relationship between the scattering of the hardness of the metal and the degree of damage.
Interest to change the parameter of hardness as a result of accumulation of fatigue damage in metal came from researchers for a long time (Булычев, 1990; Марковец, 1979). In his work (Иванова, 1963) Ivanova summarizes work undertaken in this direction. The following describes the major trends identified by hardness:
Can be expected that the hardness of the surface layer of metal is an objective indicator that does not depend on the amplitude of the voltage, medium voltage cycle, the type of loading (tension, compression, bending and twisting), and varies in proportion to the accumulated damage in the metal.
Obtained in the dependence of the change in the hardness of the damaged metal has a rather shallow part of a range of cumulative damage from 0,7 to 1. If you use this relationship to determine the state of metal can be considerable error in estimating the degree of damage accumulation in metals using the experimental dependence in the above range of damage. However, it is this part of the dependence is of great interest in assessing the residual life of steel lifting machines with expired service life.
One of the recent studies on the behavior of the hardness of the metal is (Лебедев, Музыка, Волчек, 2002) that used with the technical control of the state of the metal active components by the hardness is very sensitive (the dependence is not always unambiguous) to transform the structure of the metal in the process of use. To quantify the effect of decreasing the homogeneity of the metal is suggested to use the coefficient of homogeneity and coefficient of variation for measuring the hardness (Лебедев, Музыка, Волчек, 2002; Петрова, 2009; Лебедев, Музыка, Волчек, 2003). These options allow you to evaluate the degree of damage of the metal on the first and second stages of destruction – i.e. before the development of the main crack.
Estimated damage of metal deformation loosening (irreversible increase in the pore). Were based on data from other researchers who have identified an increase in volume of the metal with increasing cumulative damage to it. During the experiment, measurements were made of hardness of the surface layer of metal pipes, which were operated for a long time and a similar new metal pipes. It was found that:
The main disadvantages in terms of applicability to the diagnosis of metal-structure port handling machines are the following:
The most promising are the last two methods of control – the hardness of the surface layer of metal (either parameters computed on the basis of hardness) and the parameter of coercive force. However, as shown in this chapter, many aspects of their application is still not fully understood.
The main requirement when choosing this property – a good correlation between his change and the accumulation of damage in steel structures. The developed approach in order to evaluate the possibility of further exploitation of the reloading machine with outdated, based on the real state of the metal in hazardous areas, while maintaining their integrity. This will help remove any lifting machinery into two groups: valves with a large residual resource, which can be operated on; cranes, who have exhausted their resources in full and further operation of which will lead to accidents (Fig. 1).

Figure 1. Gantry crane accident
Recently, for the diagnosis of crane metal widely distributed magnetic method for setting the coercive force (Hc). Existing guidance on the definition of state of metal on the basis of the values of the coercive force (Ukrainian Standard МВ 0.00-7.01-05) indicate the difference of the laws change Hc depending on the level of stresses acting in the test cell. However, the results of experiments only for the four levels of stress.
The purpose of this paper is to propose a model by which you can find the variation of coercive force at an arbitrary level of stress. It is based on data from the experiment in Annex 6 (Ukrainian Standard МВ 0.00-7.01-05).
If the expert examination of metal gets into a dangerous element of the value of the coercive force Hc = 4 A / cm, then this information is not sufficient to assess the extent of accumulated damage. For uniqueness it is necessary to know what stresses acting in the element, since a high stress (350MPa), the acting stresses the value of Hc = 4 A / cm corresponds to 95% of the residual resource (Fig. 2), and low stress (200 MPa) – 10% residual resource.
For the convenience of the subsequent arguments we construct the dependence of Hc = f (N) in the coordinates of Hc, affection (D) (Fig. 2). By D we mean the damage (Voyiadjis, Kattan, 2005; Lee, Pan, Hathaway, Barkey, 2005) accumulated in the metal under the action of a certain number of cycles, but for simplicity we use a linear hypothesis of summation of damages for the determination of this parameter: D = n / N. According to the linear hypothesis of damage accumulation, n – number of cycles of loading, N – number of cycles of loading to fracture.

Figure 2. Dependence of the parameter Ns from damaged metal sample (green – 350 MPa; purple – 300MPa; turquoise – 250 MPa; yellow – 200 MPa).
To overcome the complexities of approximating polynomial was constructed on the basis of experimental data. Approximation was carried out by least squares. Figure 3 shows a graph of the approximating polynomial and the experimental points.

Figure 3. Approximating curve and the experimental data

The analytical expression for the polynomial has the form:

Knowing the stress in the metal site and the value of the coercive force it can determine the degree of accumulated fatigue damage. With this mathematical model, it is possible to predict with 95% probability that the accuracy of the damage will be within 30% of the absolute error. Error estimation was done using Pearson’s criteria.
Due to the large relative error in determining the damage of the most loaded metal sites are invited to use the option of coercive force for rapid assessment of the damage of the metal and the containment of dangerous places. After finding the dangerous places to be adopted more accurate (and usually less productive), another method, for example, the scattering of hardness.
References
НПАОП 0.00-1.01-07. Правила устройства и безопасной эксплуатации грузоподъемных кранов [NPAOP 0.00-1.01-07. Installation and safe operation of cranes ] Изд-во «Форт», 2007. – 256 с (in Russian).
Школьник Л. М. Методика усталостных испытаний [Shkolnik L. M. Methods of fatigue testing] М.: Металлургия, 1978. – 304 с (in Russian).
Болотин В. В. Прогнозирование ресурса машин и конструкций [Bolotin V. V. Forecasting of machines and structures resource] М.: Машиностроение, 1984. – 312 с (in Russian).
Пустовой В. Н. Диагностирование металлоконструкций портовых перегрузочных машин [Pustovoy V. N. Diagnosing the metal port-handling machines] М.: Транспорт, 1987. – 176 с (in Russian).
Котельников В. С., Янов Л. И., Попов В. А. и др. Паспорт магнитного контроля мостового крана [Kotelnikov V. S., Janov L. I. Popov V. A. and other Passport control of the magnetic crane] Подъемные сооружения. Специальная техника. 2005. – №12. – С. 20 – 22 (in Russian).
Лебедев А.А., Музыка Н.Р., Волчек Н.Л. Определение поврежденности конструкционных материалов по параметрам рассеяния характеристик твердости [Lebedev A. A., Muzyka N. R. Volchek N. L. Determination of damage of structural materials in the parameters of the scattering characteristics of hardness] Пробл. прочн. – 2002. – №4. – С. 5 – 12 (in Russian).
Петрова М. К. Оценка степени поврежденности металла неразрушающими методами контроля [Petrova M. K. Assessment of the extent of damage of the metal non-destructive methods] Всероссийская молодежная школа – конференция “Современные проблемы материаловедения”: Сборник трудов, Пицунда, Абхазия. – М.: Издательство МИСИС, 2009. – С. 299 – 305 (in Russian).
Прохоров А. В. Магнитный контроль (по коэрцитивной силе) уровня накопленных усталостных повреждений при циклических нагрузках в сварных соединениях сталей 09Г2С и ВСт3сп5 [Prochorov A. V. Magnetic control (by the coercive force), the level of accumulated fatigue damage under cyclic loading in the welded joints 09G2S and VSt3sp5] (http://www.ogbus.ru/authors/Prokhorov/prokh1.pdf) (in Russian).
Березин А.В.; Отв. ред. Неперпаш Р. И. Влияние повреждений на деформационные и прочностные характеристики твердых тел [Berezin R. I. Effect of damage on deformation and strength properties of solids] монография // М.: Наука, 1990. – 135 с (in Russian).
Конаков О. А., Колмаков А. Я. Регистрация изменений ресурсных характеристик узлов сложнонагруженных крановых конструкций [Konakov O. A. Kolmakov A. J. Registration changes the resource characteristics of nodes slozhnonagruzhennyh crane structures] Тяжелое машиностроение. – 2006. – №1. – С. 26 – 27 (in Russian).
Москвин П. В. Разработка методики прогнозирования остаточного ресурса сварных металлоконструкций с использованием датчиков деформации интегрального типа: на примере мостовых кранов [Moskvin P. V. Develop methods to predict the residual life of welded steel with integral-type strain gauges: the case of bridge cranes] Дисс. … канд. техн. наук: 05.03.06, 05.02.11. – Челябинск, Юж.-Ур. гос. ун-т. – 127 с (in Russian).
Троценко Д. А., Давыдов А. К., Зайцев А. Н. Экспериментально–расчетный метод прогнозирования остаточного ресурса металлоконструкций мостовых кранов с использованием металлических пленок [Experimental and computational method of residual life forecasting of bridge cranes metal structures with metal films] Подъемные сооружения. Специальная техника. – 2007. – №7 . – С. 26 – 28 (in Russian).
ГОСТ 7564-97. Прокат. Общие правила отбора проб, заготовок и образцов для механических и технологических испытаний [Rolled. General rules for sampling, blanks and samples for mechanical and technological tests] М.: Изд-во стандартов, 1997. – 24 с (in Russian).
Котельников Владимир Семенович. Методы диагностирования и риск-анализа металлоконструкций грузоподъемных машин в управлении их безопасностью [Methods of diagnosis and risk analysis of metal lifting equipment to manage their security] Дис. … д-ра техн. наук: 05.05.04. – Новочеркасск, 2007. – 355 с (in Russian).
МВ 0.00-7.01-05. Методичні вказівки з проведення магнітного контролю напружено-деформованого стану металоконструкцій підйомних споруд та визначення їх залишкового ресурсу [Guidelines for the control of magnetic stress and strain of lifting metal structures and determination of their residual life] 2005. – 58 с (in Ukrainian).
ГОСТ 30415-96. Неразрушающий контроль механических свойств и микроструктуры металлопродукции магнитным методом. – М.: Издательство стандартов [Nondestructive testing of mechanical properties and microstructure of metal magnetic method] 1997. – 11 с (in Russian).
Булычев С. И., Алехин В. П. Испытание материалов непрерывным вдавливанием индентора [Bulychev S. I. Alekhin V. P. Materials testing continuous indentation] М.: Машиностроение, 1990. – 224 с (in Russian).
Марковец М. П. Определение механических свойств металлов по твердости [Markovets M. P. Determination of mechanical properties of metals on the hardness] М.: Машиностроение, 1979. – 191 с (in Russian).
Иванова В. С. Усталостное разрушение металлов [Ivanova V. S. Fatigue of metals] М.: Металлургиздат, 1963. – 256 с (in Russian).
Лебедев А.А., Музыка Н.Р., Волчек Н.Л. Новый метод оценки деградации материала в процессе наработки [Lebedev A. A. Muzyka N. R. Volchek N. L. A new method of assessing material degradation in the process of use] Железнодор. Транспорт Украины. – 2003. – №5. –С. 30 – 33 (in Russian).
Дж. Коллинз. Повреждение материалов в конструкциях. Анализ. Предсказание. Предотвращение [D Kollins Damage to materials in constructions. Analysis. Prediction. Prevention] Пер. с англ. // М.: Мир, 1984. – 624 с (in Russian).
Гохберг М. М. Металлические конструкции подъемно-транспортных машин [Gohberg M. M. Metalware of cargo lifting and conveying machines] Л.: Машиностроение, 1976. – 299 с (in Russian).
Young-Li Lee, Jwo Pan, Richard Hathaway, Mark Barkey. Fatigue testing and analysis. Theory and practice. Elsevier. – 2005. – 402 p.


